
See what the market pays before you sign your next contract
Freight benchmarks and market intelligence that help shippers buy smarter, run faster tenders and strengthen their supply chain.
Trusted by the world's largest
shippers, forwarders, carriers and airlines.












Costs, reliability, speed. All under pressure
Costs under scrutiny
Finance needs proof your rates are competitive. Every surcharge counts.
Reliability hits margins
Delays disrupt deliveries, drive up costs and cut into revenue.
Spreadsheets slow you down
Manual work creates errors, wastes time and kills your tender leverage.
The world's most complete view of freight
Independent market truth at global scale, gathered from real shippers, real forwarders and real movement, every day.
900M+
Ocean & air freight rates
Refreshed every 24 hours
170K+
Port-to-port pairs covered
Across 165 countries
20K+
Airport-to-airport pairs
Live carrier coverage
Every benchmark built on real contracted rates
Decisions without data cost you in delays and overspend. Xeneta gives you one source of truth: rates shippers and forwarders actually paid, plus reliability and capacity data, on every lane you buy.
What you can do with Xeneta
Choose the right carriers, run market-aligned tenders and plan budgets on one platform.
Suppliers visual
This page could not be loaded. Please try again later.
Choose the right carriers
See how your rates compare on price, reliability and service.
Evaluate carriers on price, schedule reliability and service
Flag underperforming or overpriced suppliers with AI
Back volume allocation and sourcing shifts with data
Tenders visual
This page could not be loaded. Please try again later.
Run market-aligned tenders
Benchmark thousands of lanes in minutes. Know the market, own the table.
Set market-aligned targets for RFQs and volume splits
Evaluate bids with AI-powered outlier detection
Validate final awards against market benchmarks
Plan visual
This page could not be loaded. Please try again later.
Plan with market intelligence
Plan freight budgets and manage risk with neutral, real-time data.
Forecast contract rates up to 3 months ahead
Model cost scenarios by lane, region and mode
Track blank sailings, reliability and surcharges
Go further with indexing
Cut tender time from months to days and handle any market with an index-linked contract.
Align rates to real market movements
Spend less time on rate disputes
Prove fairness internally and externally
Build trusted supplier partnerships without giving up control
Animated visual
One platform. Two modes
Ocean visual
This page could not be loaded. Please try again later.
Live benchmarks, performance insights and data you can trust, to change how you buy and manage ocean freight.
Discover Xeneta OceanAir visual
This page could not be loaded. Please try again later.
Benchmarks, trends and carrier insights to plan and negotiate air freight, with control over spend and service.
Discover Xeneta AirMade for the teams shaping your freight strategy
Give procurement, supply chain and finance one view of the market, so every team works from the same numbers.
See how leading shippers buy freight smarter

Shorter tender cycles, less manual work
How Nestlé compressed tender cycles and elevated procurement decisions with real-time data.
Read the case study
3–5% savings and 20% faster tenders
Shipping 40,000+ FEU a year, Stanley Black & Decker saves millions with Xeneta Market Insight.
Read the case studyHow shippers regain leverage in carrier-led markets
Our analysts answer the 48 questions shippers raised at our recent roundtables, so you can go into your next tender with a plan.
Get the report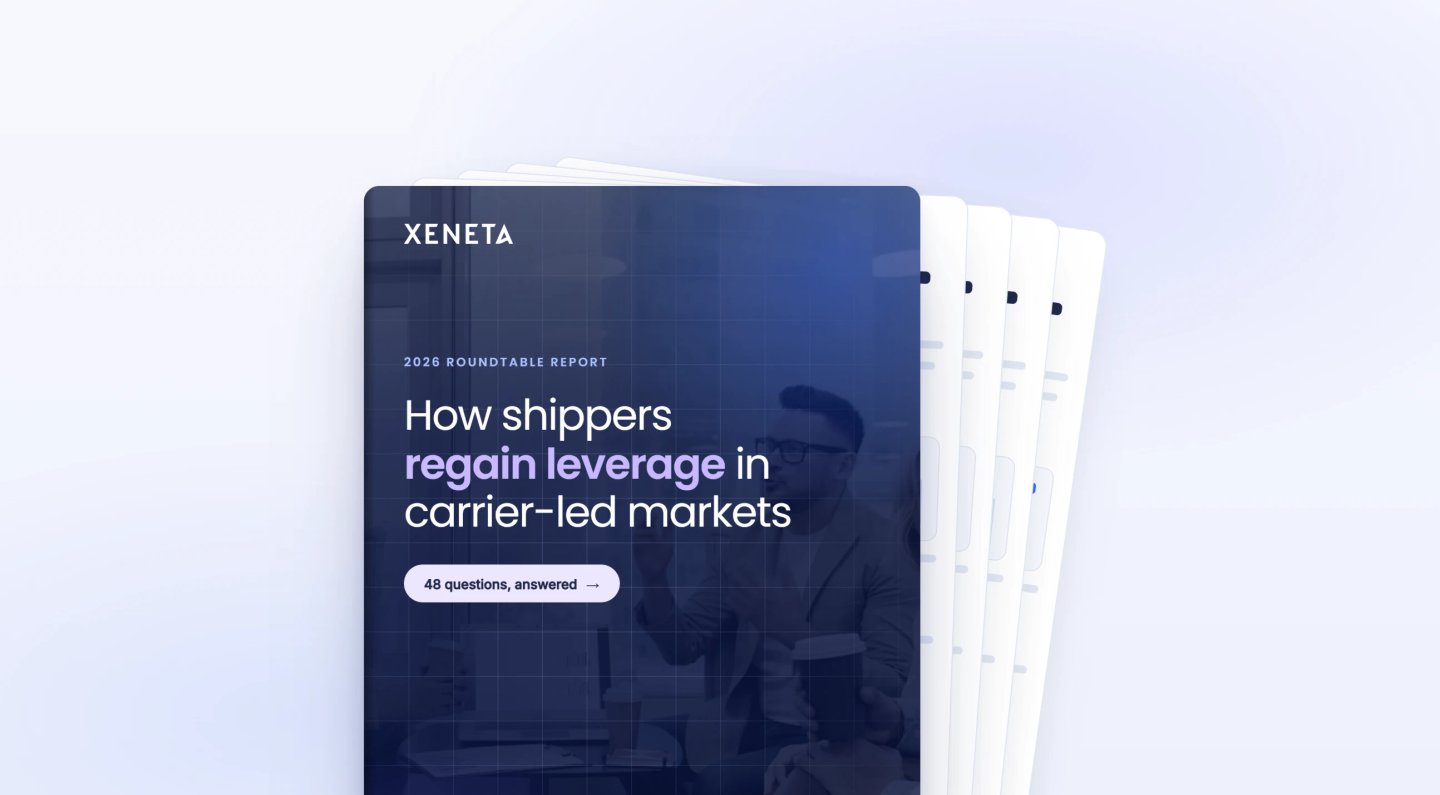
Fresh thinking from our freight analysts

Why every disruption now comes with a surcharge
What the data says about the surcharge debate, and what shippers can do about it.
Read the blog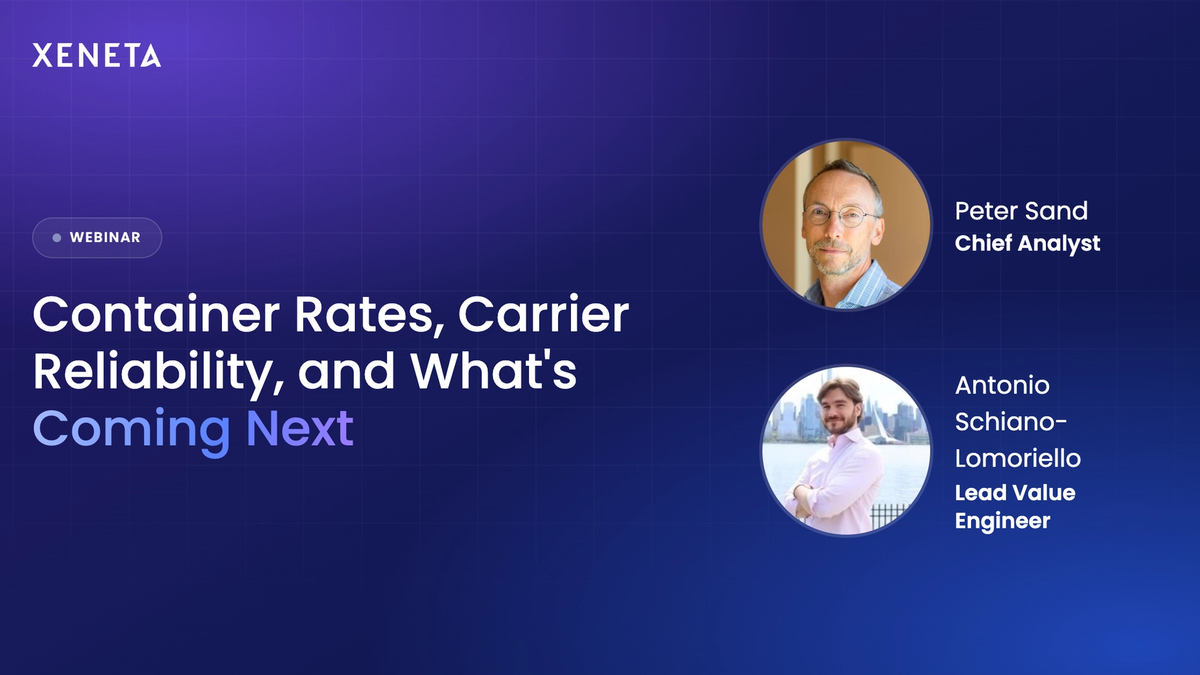
Dry cargo rates and carrier reliability
Benchmarking dry cargo lanes live and comparing carriers on price and reliability.
Watch now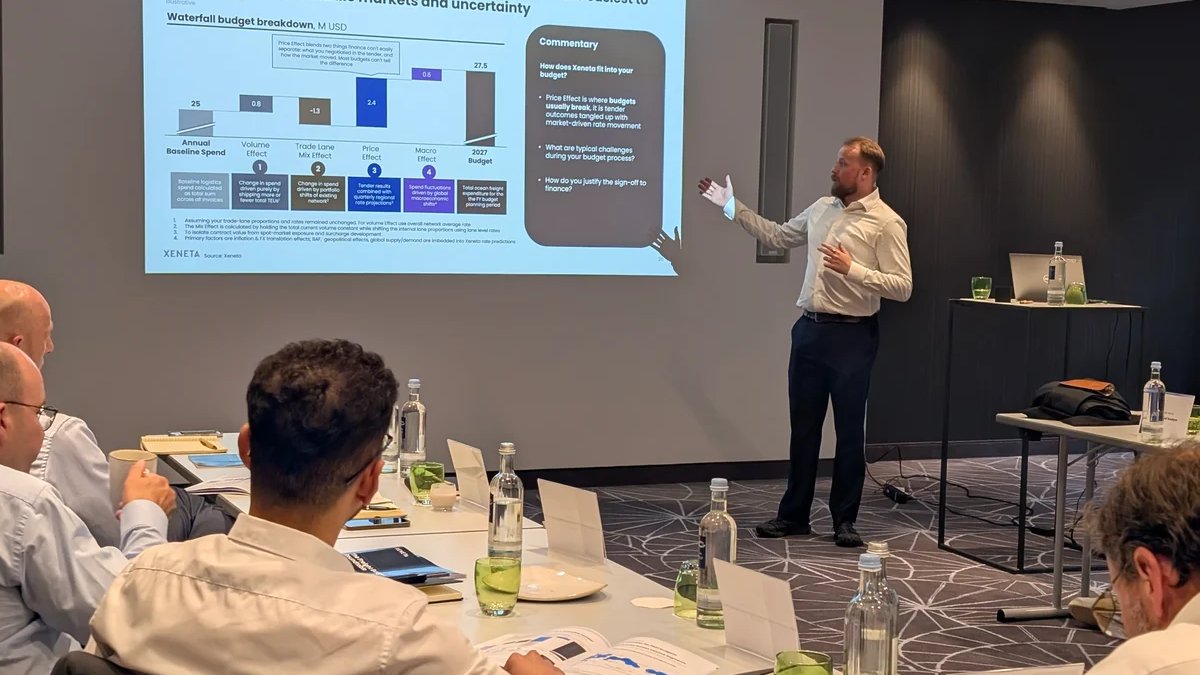
What it takes to defend a 2027 freight budget
What shippers told us in our procurement roundtables about defending next year's budget.
Read the blogFrequently asked questions
How do shippers use Xeneta?
Procurement, supply chain and finance teams use Xeneta to benchmark ocean and air rates against the market, evaluate carriers, run market-aligned tenders and plan freight budgets with rate forecasts.
Where does Xeneta's rate data come from?
Xeneta's benchmarks are built from 900M+ real contracted and spot rates shared on an anonymised basis by shippers and forwarders worldwide. You see what the market is actually paying, not indicative or estimated prices.
Does Xeneta cover both ocean and air freight?
Yes. Xeneta covers 170,000+ port-to-port pairs for ocean and 20,000+ airport-to-airport pairs for air, so you can benchmark and plan across both modes on one platform.
Can Xeneta help me evaluate my carriers?
Yes. You can compare carriers by corridor on price, schedule reliability and service, flag suppliers priced above the market and back volume allocation decisions with data.
How quickly can my team get started?
Book a demo and we'll walk you through the platform on your own lanes. From there, our team helps you set up the corridors, contracts and alerts that matter to your business.