




Global reliability plummets as Far East to Europe collapses to 6% on-time
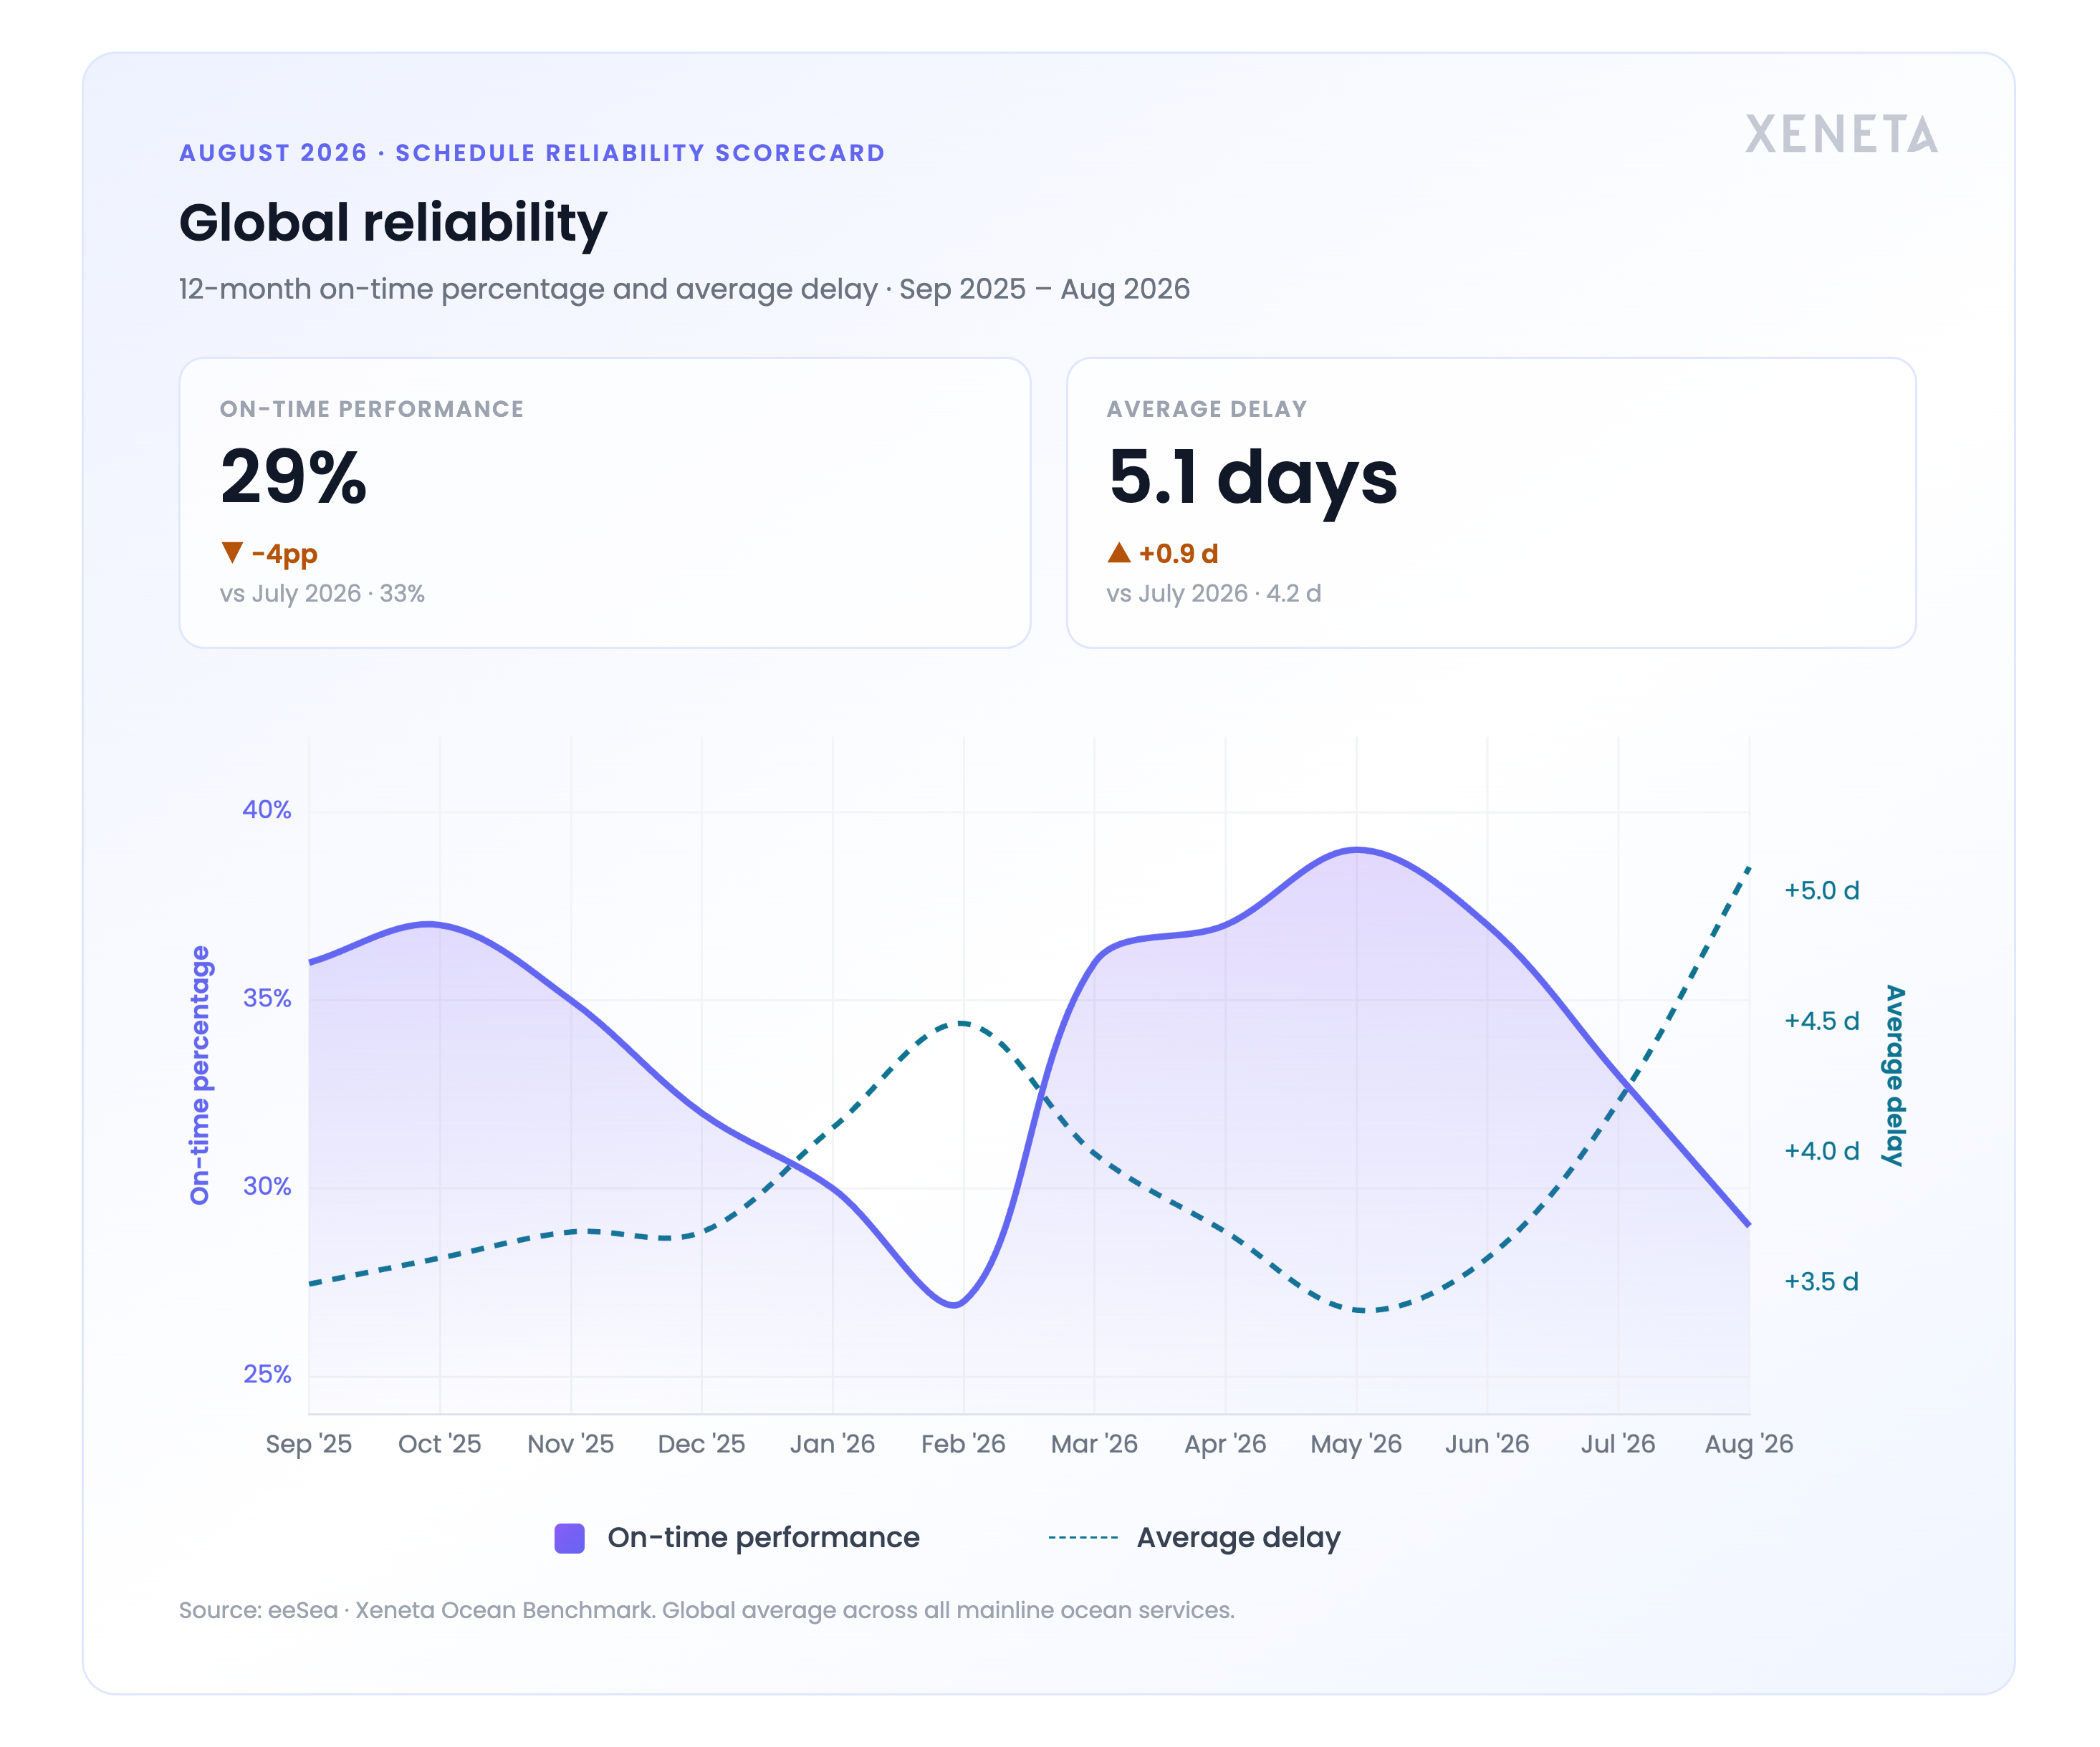
Global reliability declined for the third month running in August, effectively erasing the recovery from February’s floor of just 27% on-time. A drop of –4pp to 29% on-time last month, following an equal drop from June (37%) to July (33%) has now delivered the second-worst schedule reliability of the past 12 months.
Average delay is moving in lockstep, increasing by nearly a full day from +4.2 to +5.1 days from July to August. When the severity of delays matches the increasing frequency of late arrivals, recovery becomes harder to attain and retain.
To put this trend in perspective, the last time global on-time arrivals were sustained at or below 29% was from July 2024 through January 2025: the final days of THE Alliance and 2M when schedule adherence was practically diminished to a concept.
Trades: Far East to Europe breaches the worst levels of Pandemic-era reliability
Trade level reliability reveals where pressure in August hit on-time arrivals the hardest: Africa (21%) dropped 15pp, South America East Coast (34%) dropped 12pp, and Far East to Europe (6%) dropped 10pp. 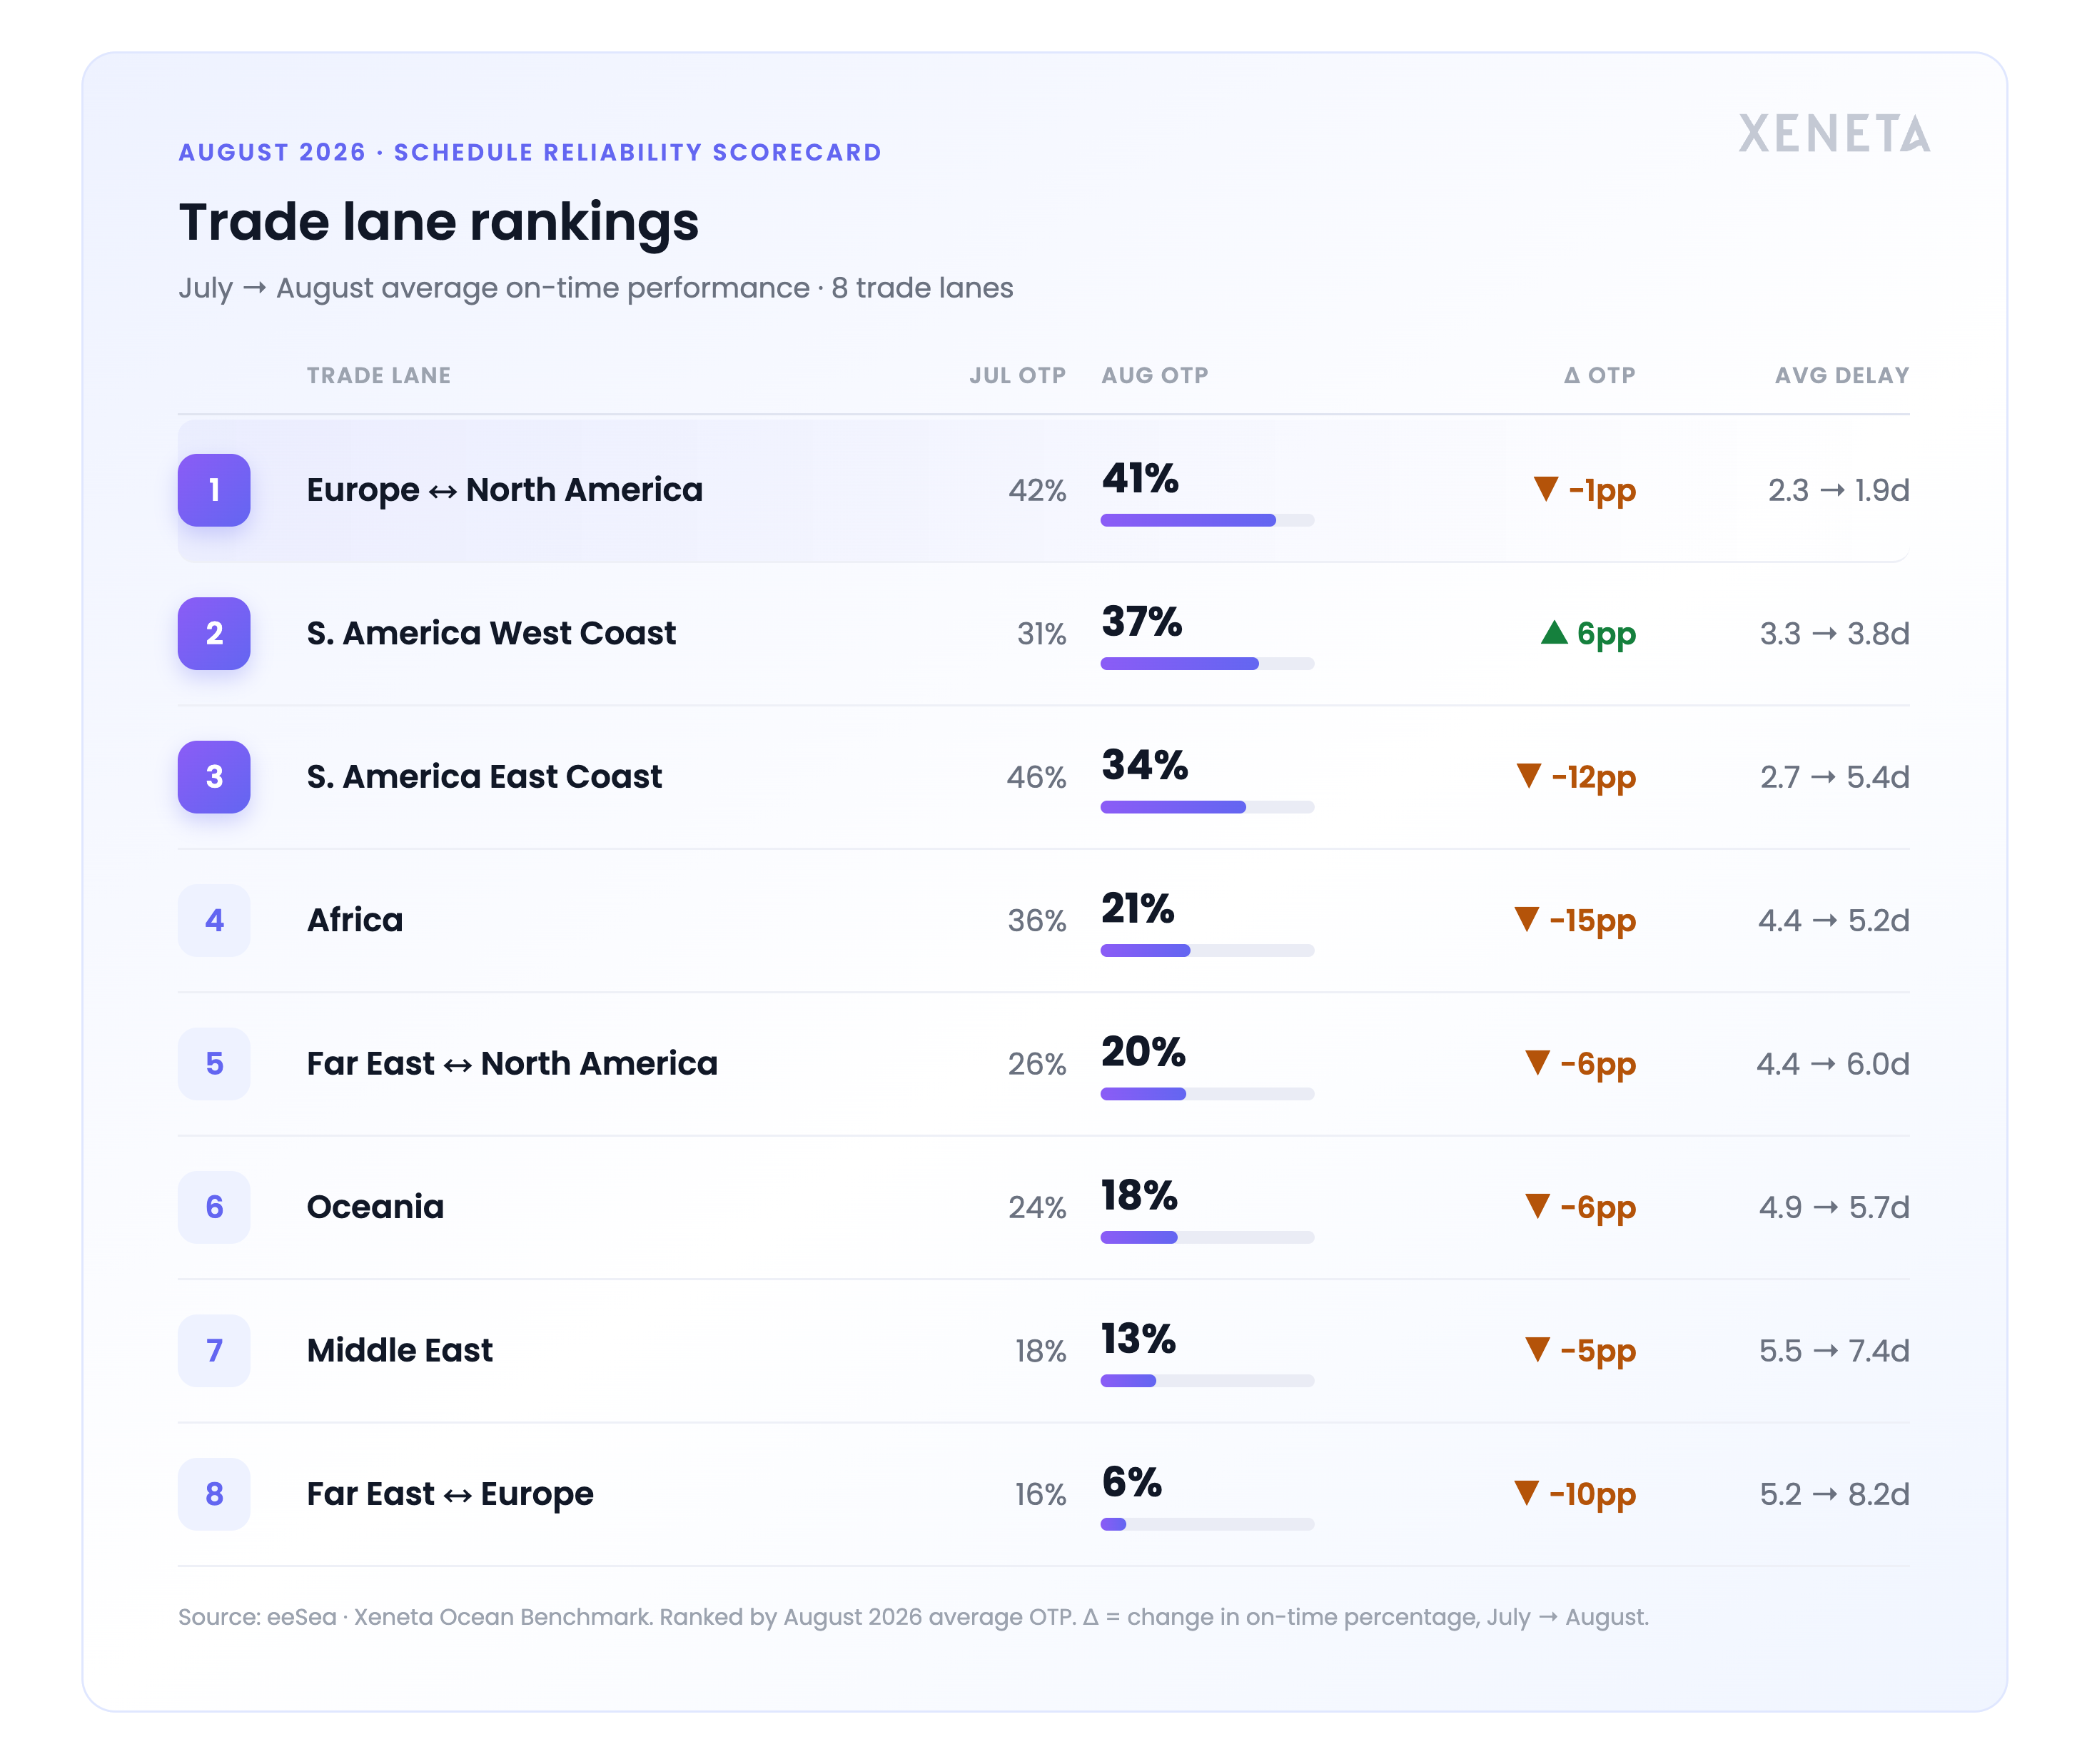
Reliability issues on South America’s East Coast doubled delays up to +5.4 days and were partially rooted in a three-day pilotage strike across Argentina’s ports in the beginning of August. Average berth arrival delays increased by +1.6 days at ports like Buenos Aires and encouraged some carriers to divert volumes to neighbors like Montevideo and Itajai. The timing proved critical as work stoppages coincided with the final month of Argentina’s primary export season and the lead up to Brazil’s peak season.
Despite the decline, South America East Coast remains just behind sister trade South America West Coast (37%) and within the top 3 most reliable trades. 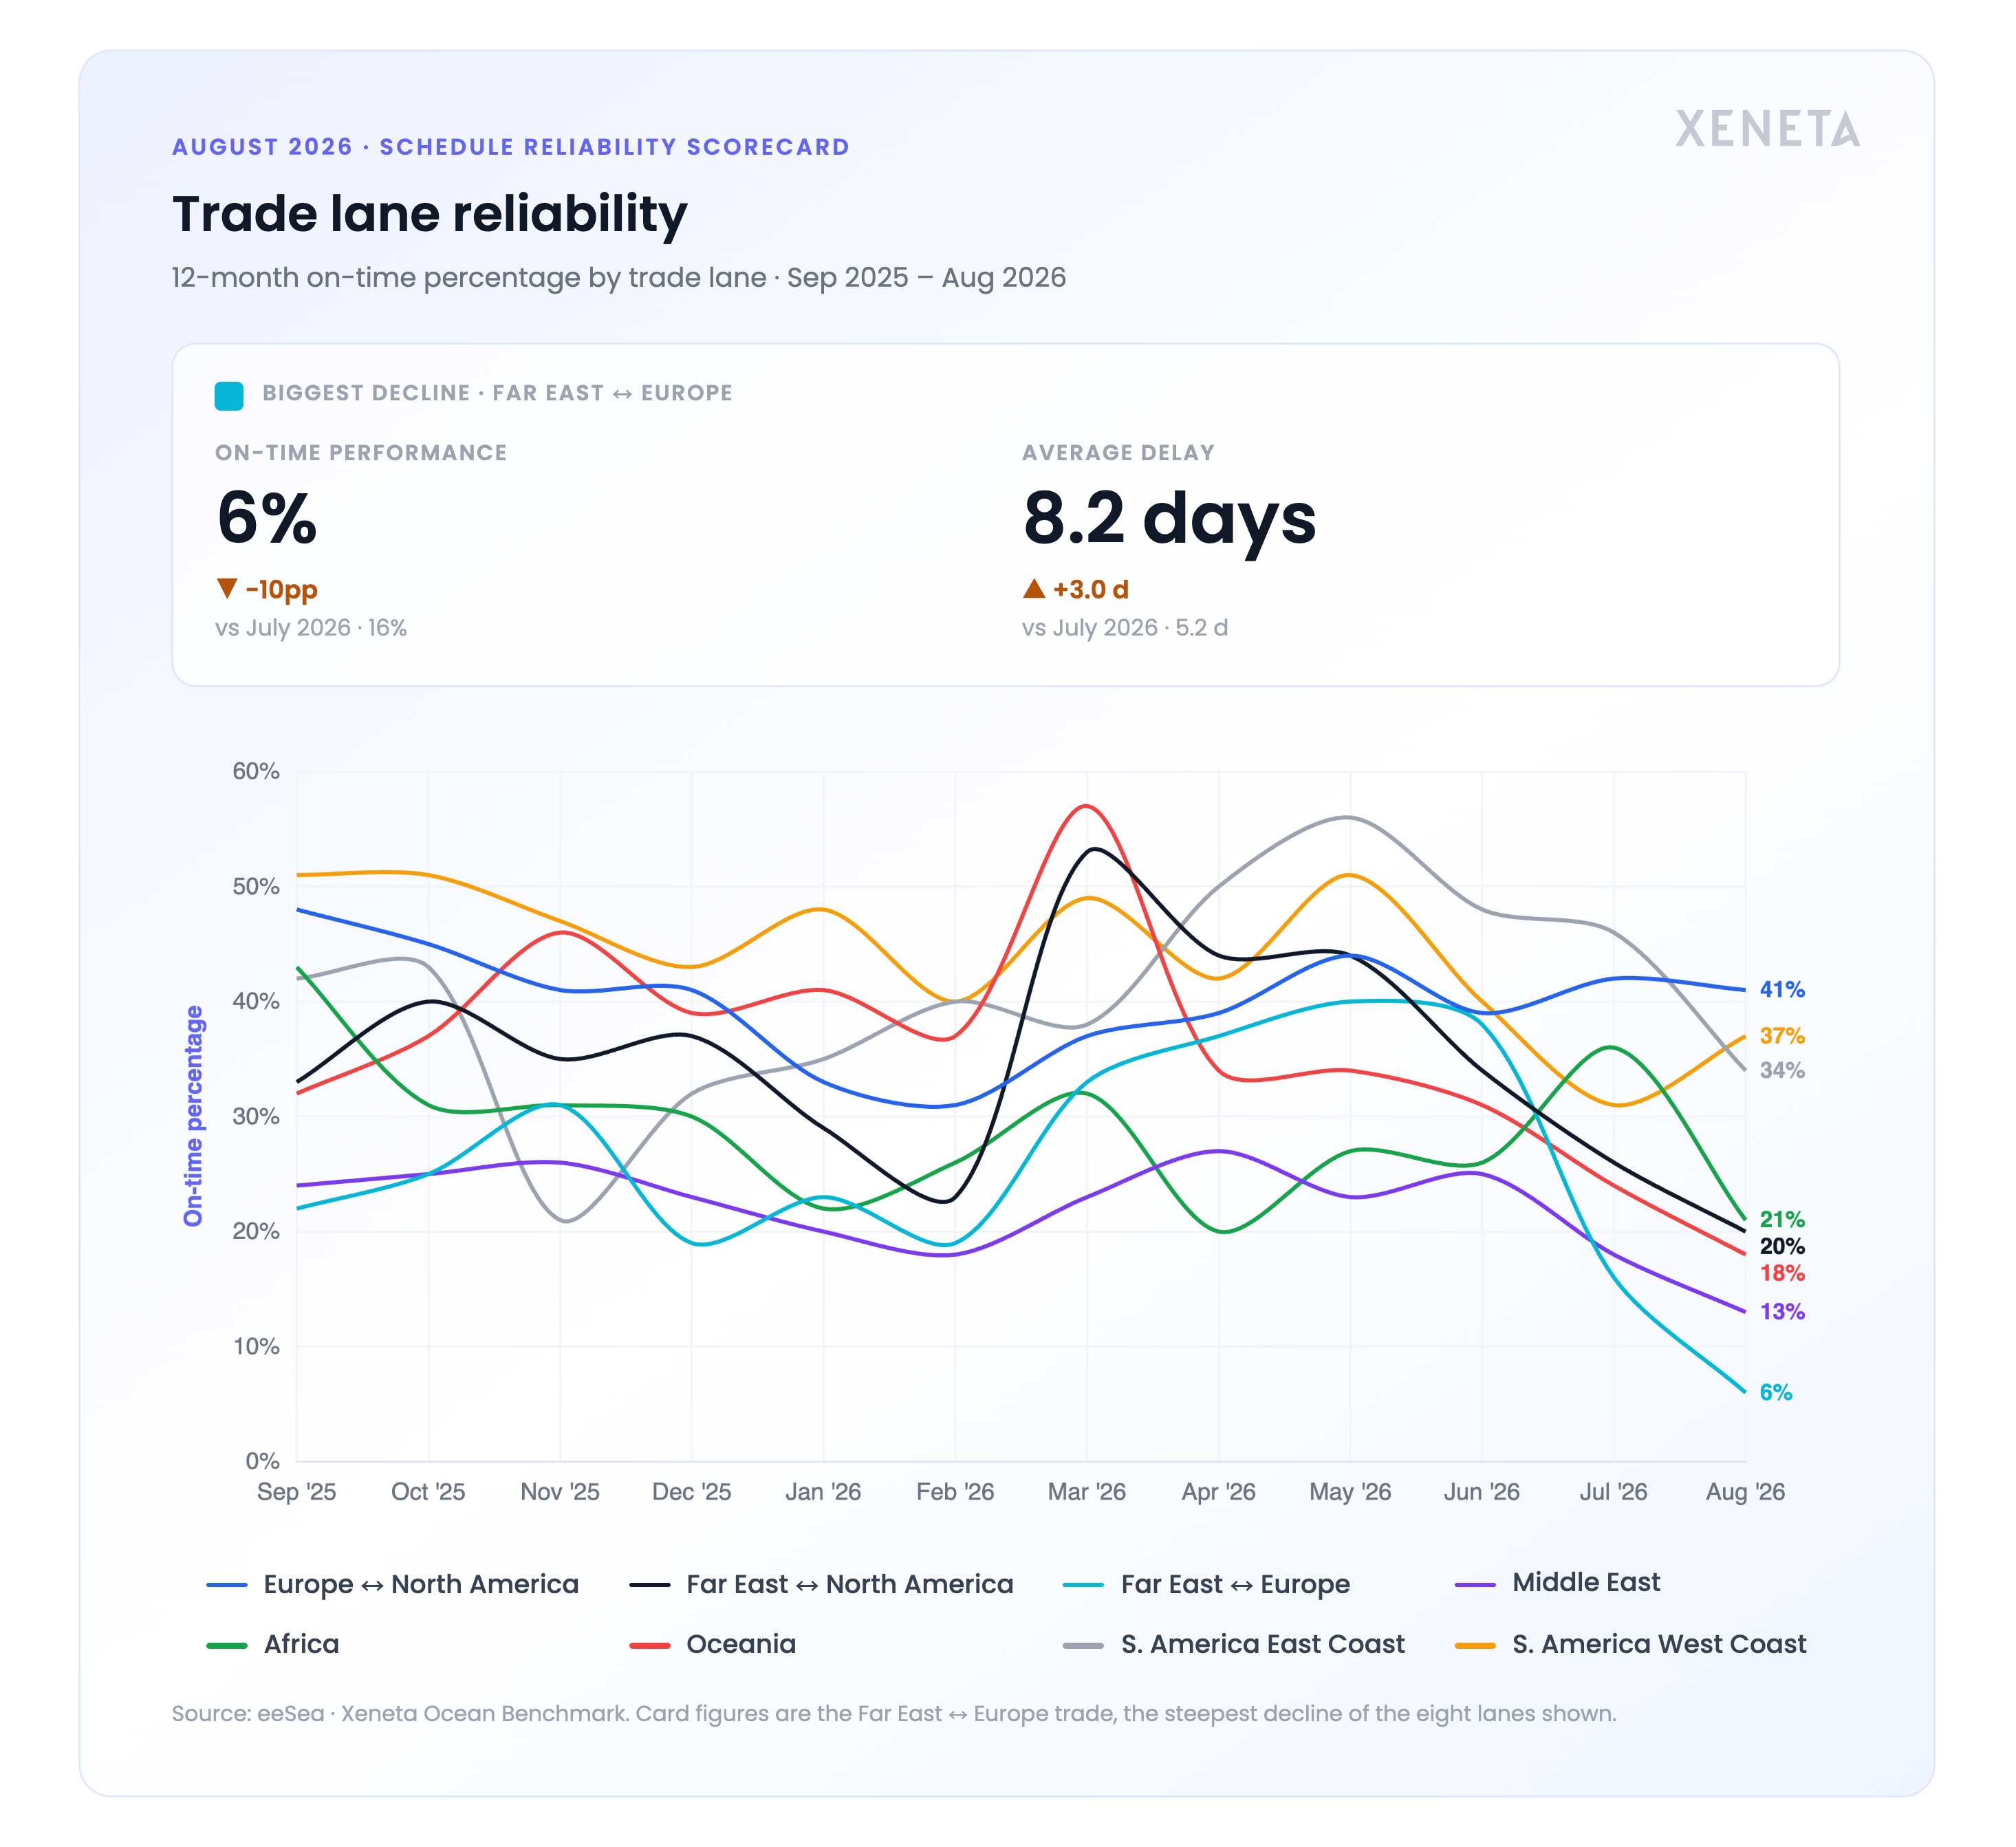
Far East to Europe is the headline story: one of the world’s busiest shipping arteries is practically grazing the floor at just 6% of arrivals on-time and +8.2 days of average delay, hitting levels not seen since the height of the pandemic in late 2021.
There has been no shortage of contributing factors to chronic schedule disruptions on this trade since the onset of the Red Sea crisis. From extended Cape of Good Hope transit times to larger ships necessitating longer berth stays, North Europe port congestion, and extreme weather events in winter and summer months alike.
This time, the weather half a world away delivered sustained impacts on an already strained system. Four back-to-back typhoons in China saw 1.1m TEU laid up at anchorage across Ningbo, Shanghai, and Yantian the week after the final storm, Saudel, had passed.
The effects will continue to impact global trade and carrier strategies for weeks to come, compounding existing berth arrival delays downstream in both Europe and North America.
For the full story, read our latest Special Advisory Report: Summer Typhoons Send Shockwaves Through October.
Carriers: Shippers are negotiating service contracts as multiple carriers hit 12-month lows
Ten out of the top twelve carriers declined in August with six of them hitting twelve-month lows: Hapag-Lloyd, CMA CGM, PIL, HMM, Wan Hai, and Yang Ming. The 48pp spread in July narrowed slightly to 45pp, not due to convergence from both directions, but rather the leader group falling.
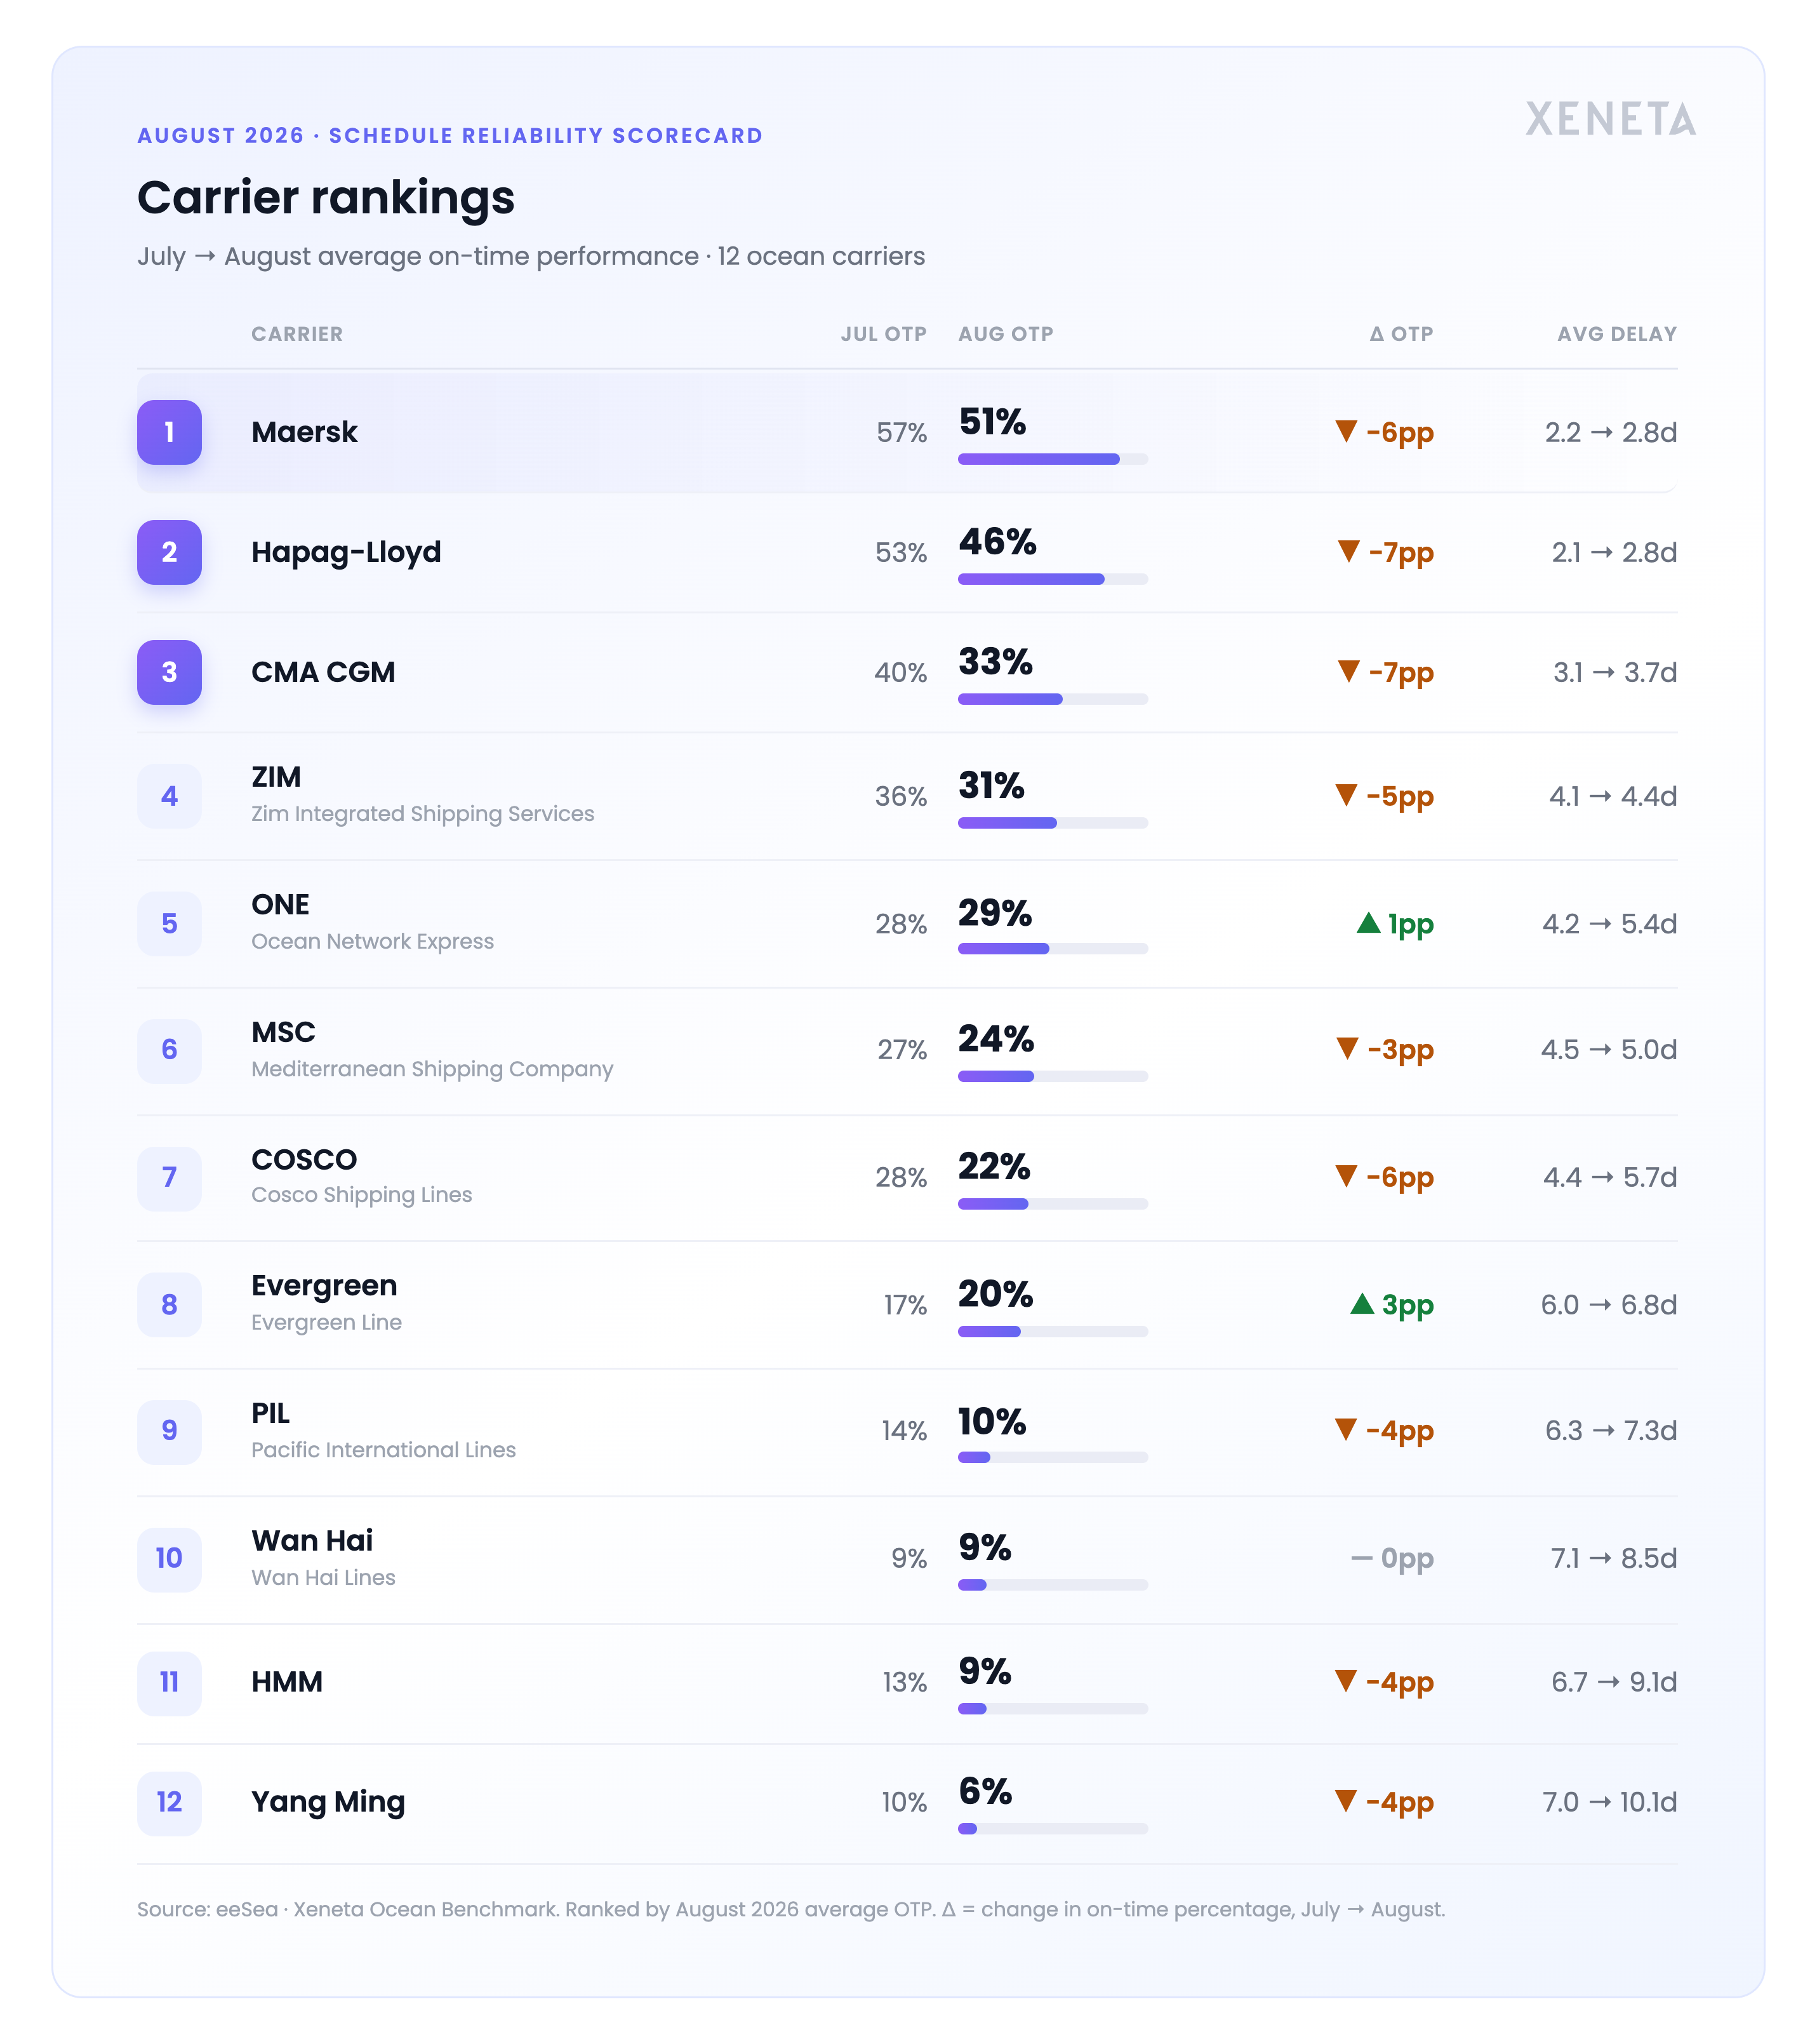
Partners Maersk (51%) and Hapag-Lloyd (46%) both dropped significantly by 6pp and 7pp each. Hapag-Lloyd is now seeing the lowest on-time arrivals since prior to the launch of Gemini Cooperation in February 2025. CMA CGM (33%) and Cosco (22%) also fell harder than peers, by 7pp and 6pp each.
Despite the broad increase in the number of vessels arriving late, Maersk and Hapag-Lloyd held the severity of that lateness in check; marking less than 1 day of increased delay and both landing at 2.8 days. HMM and Yang Ming, consistently at the bottom of the rankings, added another 2.3 and 3.1 days respectively, while climbing as high as 9 and 10 days of total average delay.
With a 45pp spread in performance across carriers and top performers Maersk and Hapag-Lloyd no longer a safe default, carrier selection remains the biggest reliability lever a shipper controls this tender season.
Port congestion: Africa remains the most congested region despite heavy typhoon impact in Northeast Asia
Ranked by average vessel wait times, Africa (3.3d) held the lead for most congested region again in August, followed by Middle East (2.3d) and Southeast Asia (1.7d).
In both Africa and the Middle East, the issues are deeply embedded and structural: port infrastructure development is consistently outpaced by demand and leads to chronic congestion and delays.
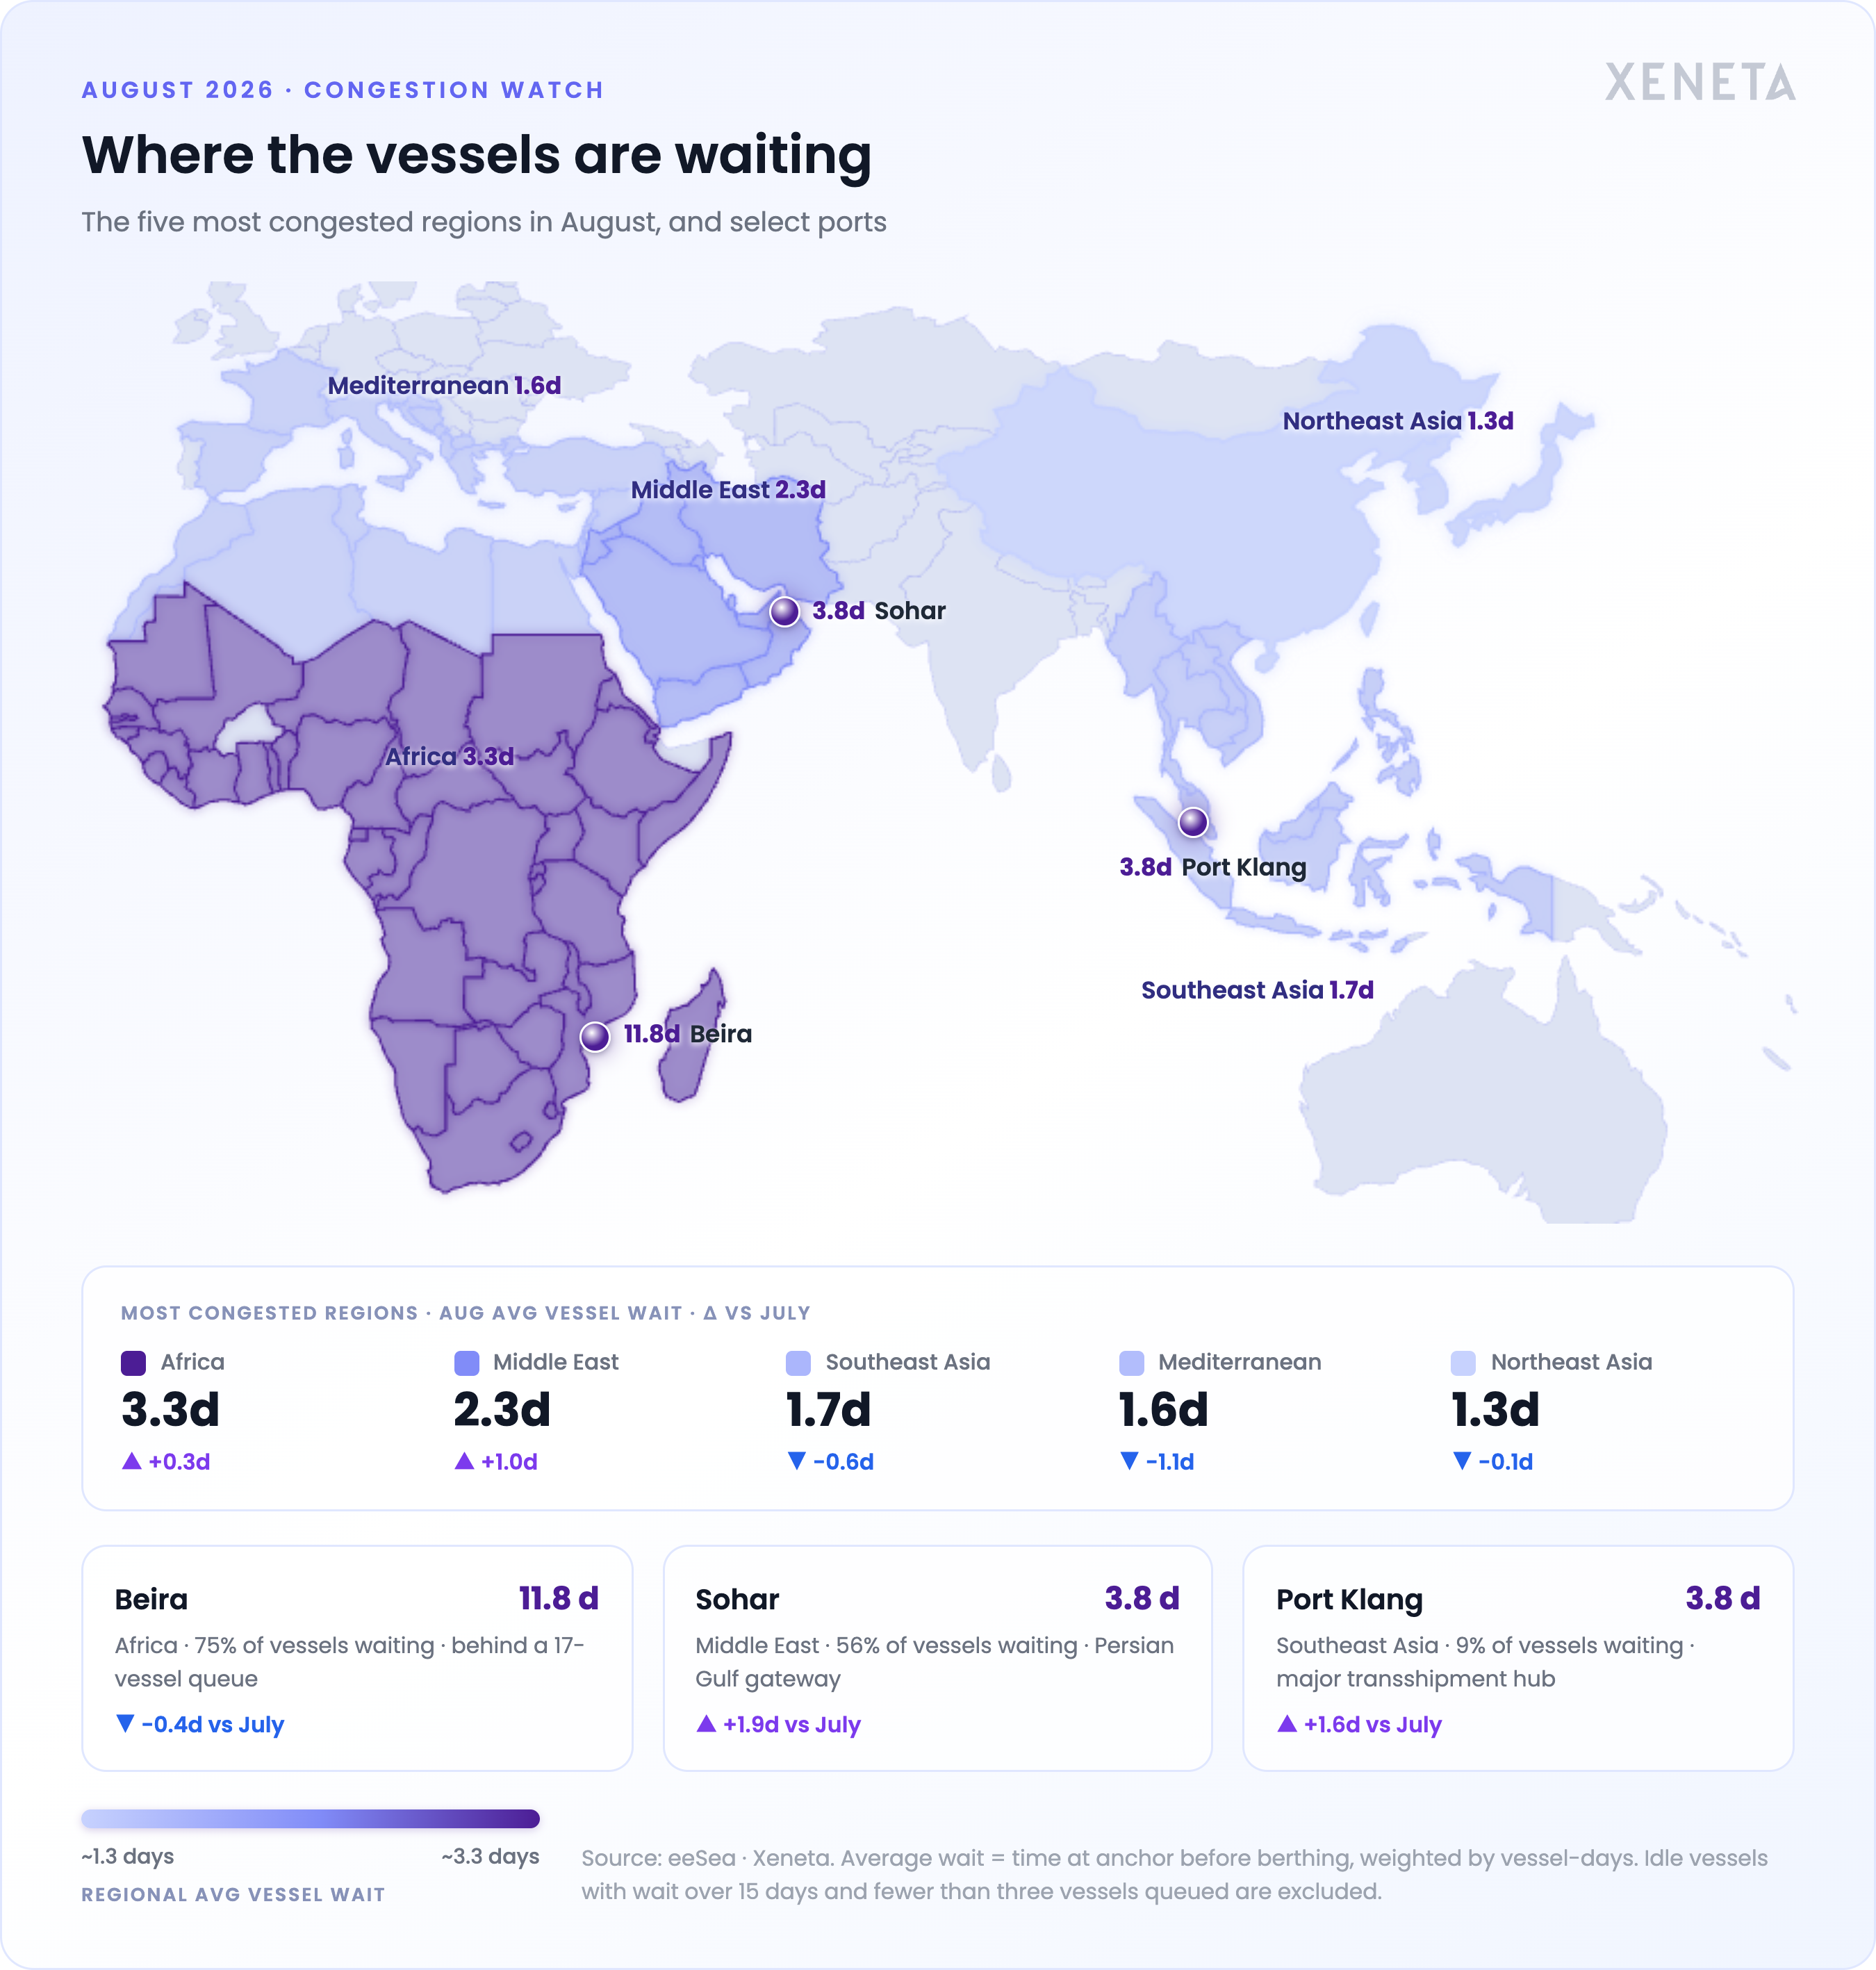
In Africa, Beira was in the spotlight with 11.8 days of average wait – that’s not an average that’s being driven by a single extreme vessel, it rests on 17 vessels waiting per day. In the Middle East, the trend is spread thinly across ports like Sharjah (4.0d), Djibouti (3.9d), and Persian Gulf gateway Sohar (3.8d), rather than concentrated in a single hub like Jeddah (0.6 d).
Northeast Asia (1.3d) may have ranked fifth in terms of vessel wait times, but it had the third highest congestion ratio of 16% of vessels in a holding pattern on any given day.
Ningbo (2.8d) exemplifies how sudden impacts don’t always manifest as longer waits, particularly when the previous baseline (3.0d in July) is already high. The number of vessels waiting in Ningbo-Zhoushan grew from an average of 39 vessels at anchorage per day to 63 in August, an increase of 63% MoM.
Wait times and vessel counts are both congestion measures, but they are distinct in meaning: Africa's structural backlogs and Ningbo's typhoon exposed vessels are different problems. For shippers, the practical test should be taken across queue length, wait severity, duration of disruption, and cargo flow. Vessels accumulating at Chinese anchorages in August transform into berth arrival delays in Europe and North America in September.
What to watch
-
With Far East to Europe down to 6% on-time and +8.2 days of delay, shippers need visibility on port pair and service performance going into Q4 tenders – including monthly updates on their lanes. This decline is not a temporary blip.
-
Panama Canal draft restrictions amount to little threat on South America East Coast, with all but one service from Asia utilizing the Cape of Good Hope route. The Atlantic storm season that peaks in September has also been relatively quiet so far. What matters most is that average delays already doubled to 5.4 days and on-time percentage fell by 12pp to 34% in August. There’s little slack left to absorb further disruption going into Brazil’s peak export season.
-
Capacity will be tight heading into China’s mid-Autumn Festival (25-27 Sep) and Golden Week (1-7 Oct), which arrive back-to-back this year and carry 10 days of factory closures. Bookings are compressed into the preceding weeks regardless of variables in peak season demand cycles. At the same time, ships slow steaming to avoid long anchorages, waiting at berth, or skipping ports to make up for lost time all absorb carrier-promised capacity and equipment availability. Stacking holiday restrictions against severe schedule disruptions on Far East to Europe and Far East to North America, we have a perfect storm of delayed capacity and climbing rates brewing on the horizon for shippers.
Know which services deliver before you sign
With Far East to Europe at 6% on-time and carrier performance spread across 45 percentage points, the tender season decisions you make now depend on knowing which services actually deliver. Xeneta Ocean Schedules gives you port pair, service and carrier reliability data, updated monthly, so you can benchmark your lanes before you commit.
.png?width=813&height=168&name=xeneta-schedules-cta-banner%20(1).png)