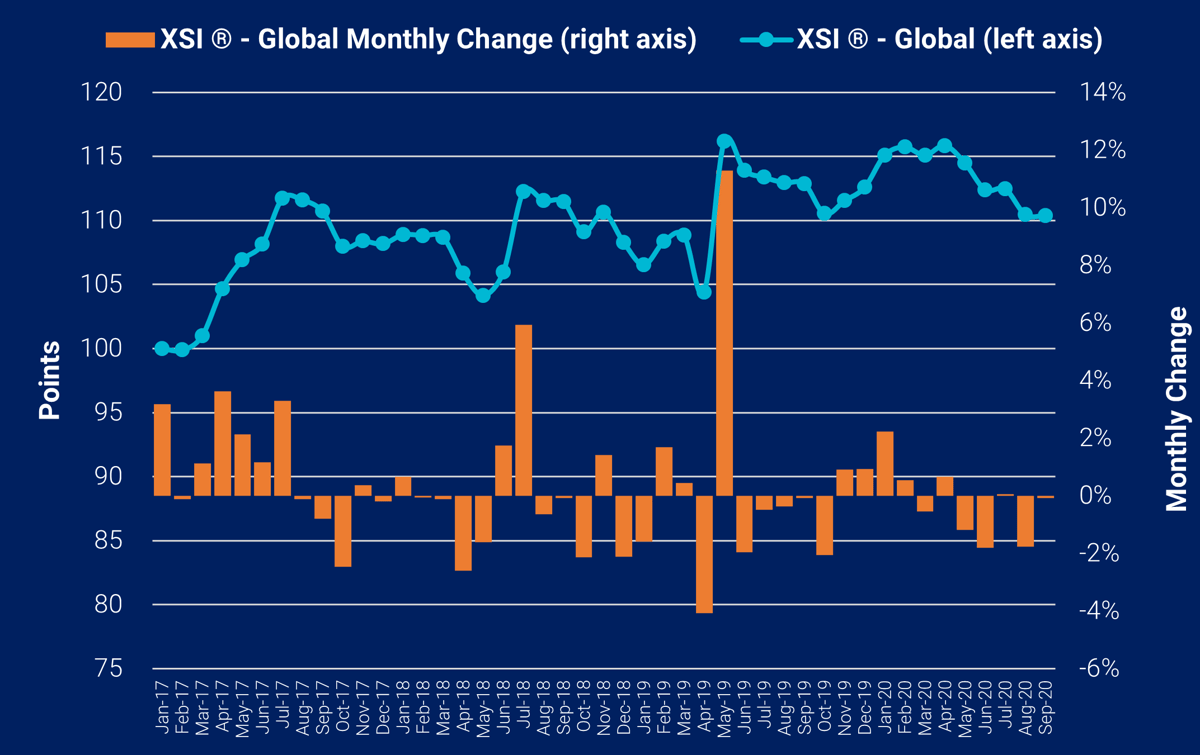
Welcome to the summary of the September 2020 edition of the Xeneta Shipping Index (XSI®) for the contract container market. Here is a snippet of how the long-term container market has moved in the 9th month of 2020.
The global XSI® declined marginally in Sep-20, falling by just 0.1% to 110.37 points. Year-on-year the benchmark is down 2.2% and it has fallen by 2.0% since the end of 2019. While the global benchmark was mostly unchanged this month, spot rates across key trades remain at historically high levels. Xeneta expects a significant rise in long-term rates as the EU tender season kicks off.
The V-shaped recovery in rates has caught many in the industry by surprise, however, with the global economic climate far from certain, question marks remain as to whether the recovery can be maintained in the medium to long-term.
Xeneta already marks a rise in long-term contract rates moving into the Q4 2020 and Q1 2021.
XSI® - Europe Imports / Exports
Imports on the European XSI® fell by 0.3% this month to 109.66 points, with the index down 1.7% compared to the equivalent period of 2019. Since the end of last year, the benchmark has shed 4.8% of its value after it was unable to sustain the all-time high that was recorded in February this year. European exports also declined month-on-month, falling by 0.4% to 114.49. More positively though, the index remains up 0.4% year-on-year and it is still 0.1% higher than in Dec-19.
XSI® - Far East Imports / Exports
Far East imports on the XSI® declined by a further 0.3% in Sep-20 to 96.38 points. Since June the benchmark has fallen by 8.7% and is down 1.9% compared to the same time last year. The index has been unable to sustain any upwards momentum and subsequently since the end of 2019 it has declined by 2.3%. Exports also fell in September, declining by 0.2% to 118.95. Whilst the index is now 2.6% lower than Sep-19, it remains up 0.3% year-to-date.
XSI® - US Imports / Exports
US imports on the XSI® increased by 0.5% in September to 120.04 points. Despite the month-on-month increase, the index remains 1.8% lower than the equivalent period of 2019 and has shed 4.0% of its value since the end of last year. Developments in US exports were less favorable, with the benchmark falling by 2.6% in Sep-20 to 88.18. As a result, it is now 6.4% lower than Sep-19 and has declined by 8.0% since Dec-19.
Get the full September 2020 XSI report (PDF) with all the market movement graphs here.
MEDIA: Please have a look at the press release here.
---


-1.jpg)


