Welcome to the first Xeneta Shipping Index Public Indices report of 2020. The year of the rat is in full swing. With much anticipation entering the new year riding the new fuel regulation hype from 2019, brace yourself, there's not much to write home about in terms of rate increases so far.
Here is a snippet of how that long-term container market has moved so far in January 2020 on the main trade corridors.
You can find an excerpt of the report below. Get the full January 2020 XSI® report (PDF) with all graphs here.
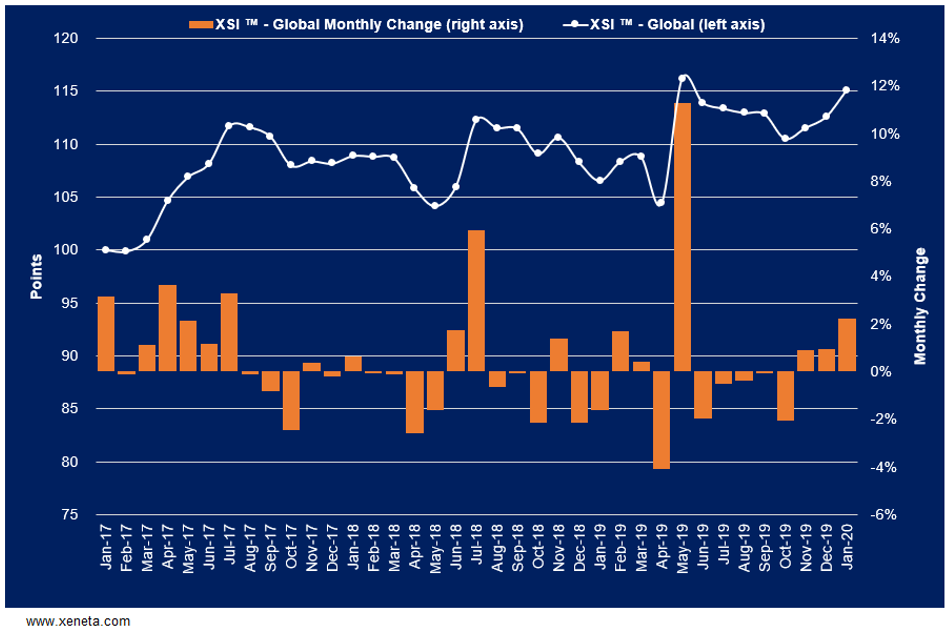
The global XSI® has continued its recent upward trend, increasing by 2.2% in Jan-20 to 115.10 points. This marks the third consecutive month-on-month increase, resulting in a rise of 4.1% since Oct-19. Subsequently, the index is now 8.0% higher than the equivalent period of 2019. If the global XSI ® continues to rise in the coming months, then it could easily surpass the all-time high of 116.19 points recorded in May last year.
Elsewhere, market commentators and our data correlate to suggest that that carriers have so far failed to fully recover the costs associated with new low-Sulphur IMO regulations. We have previously highlighted the difficulties they will face on commoditized trades, which at present seems to be the case. For example, while spot rates on the Far East-North Europe route have recently improved, one can argue that these are the product of capacity adjustments and seasonal demand rather than the successful recovery of these additional costs.
Will the carriers take off the boxing gloves and talk real business during the upcoming trans-Pacific negotiation period? TPM Long Beach will surely be interesting.
Read the full the full January 2020 XSI report (PDF) with all the market movement graphs now. Xeneta Shipping Index Public .
MEDIA: Please have a look at the press release here.
---


-1.jpg)


