The recent trend of falling spot rates has left many shippers and the wider container shipping industry pondering how much it has fallen from last year until this summer. Despite the fall in spot rate over the summer, they are still much higher than a year ago on some major trades.
Out of Xeneta’s top 13 container trades, we selected only 9 to conduct this analysis as the remaining four trades had less than 10% YoY growth. For example, no change in spot rate difference occurred for the US West Coast to Far East route, which remained at USD 1 250 per FEU.
Read more below in Xeneta's weekly container rate update.

As of August 30, 2022, the average spot rate for Xeneta’s top 13 trades was USD 450 per FEU, lower than the average spot rate a year ago, with the lion’s share of that drop happening over the summer.
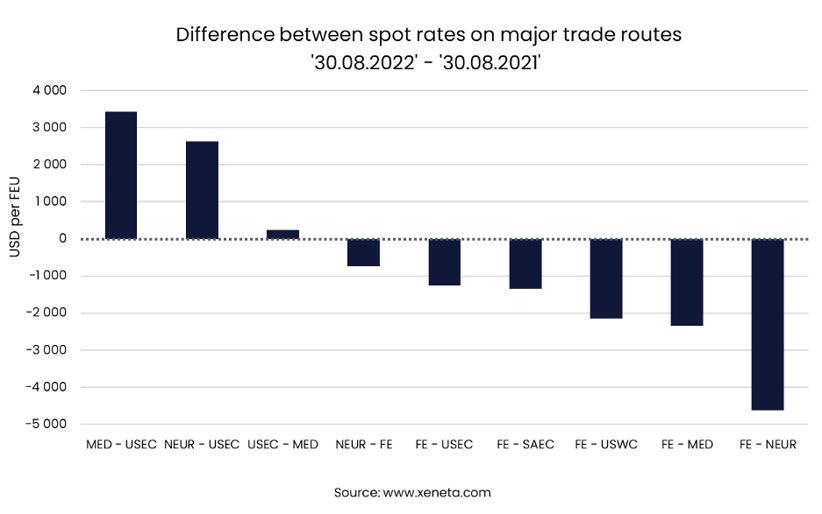
The spot rates for the Mediterranean to the US East Coast route have increased by USD 3 430, and by USD 2 630 per FEU for North Europe to US East Coast, since August 30, 2021.
Since August 30, 2021, spot rates from the Far East to North Europe have decreased by USD 4 620, to the Mediterranean by USD 2 340 and to US West Coast by USD 2 150. Almost every major trade has experienced a significant change in the spot rate compared to a year ago.
Since July 1, 2022, the average spot rate for 13 major trades has declined by 7.4% (USD 450 per FEU), with the note that the trade route from North Europe to the US East Coast route remained the same.
The most significant decline during this period was from the Far East to US West Coast (-21%), to the Mediterranean (-15%), and to North Europe (-13%).
There is also a 9% decrease in the spot rate on the Far East to the US East Coast route and a 6% decrease on the US East Coast to North Europe route.
Note:
The 'Weekly Container Rates Update' blog analysis is derived directly from the Xeneta platform, and in some instances, it may diverge from the public rates available on the XSI ®-C (Xeneta Shipping Index by Compass, xsi.xeneta.com. Both indices are based on the same Xeneta data set and data quality procedures; however, they differ in their aggregation methodologies.
Want to learn more?
The container market is no walk in the park. You need to have the latest rate and supply data to be able to plan and execute your freight procurement strategy quickly.
Xeneta's real-time and on-demand data is here to help you answer, "Am I paying the right freight rate to get my cargo where it needs to be?"
Sign up for our weekly 15-minute live group demo below and see Xeneta for yourself.


