Container shipping capacity between the Far East and the US East Coast has risen sharply from last year as shippers have shifted volumes towards the East Coast (USEC) and away from the West Coast (USWC) – and carriers have responded by adjusting their networks.
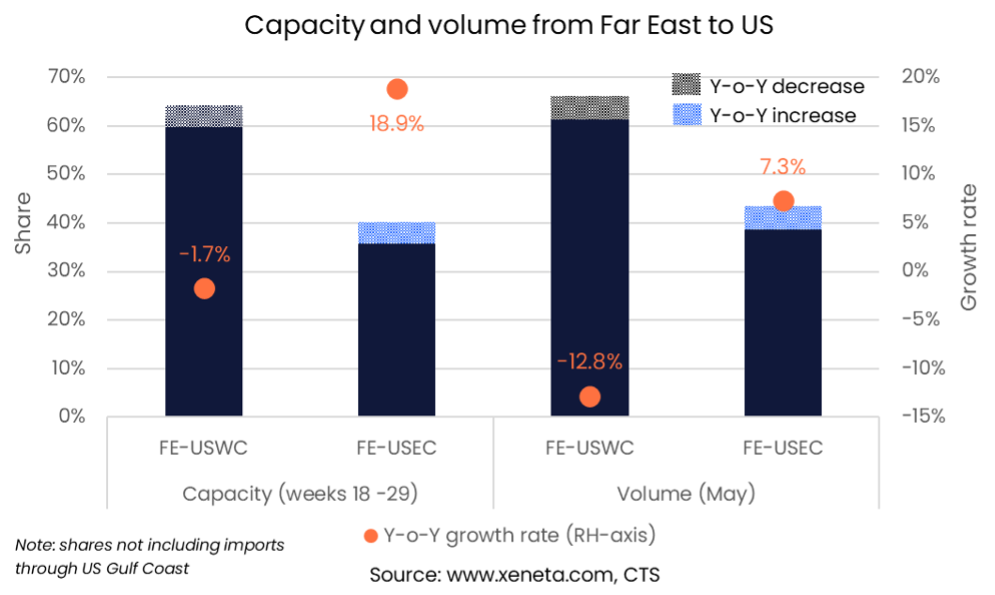
In the past three months (as of July 24th), capacity between the Far East and the US EC rose by 18.9% compared to the same period in 2021 (Source: Sea-Intelligence).
Read more below in Xeneta's latest weekly container rate update.

Over the 12-week period, the average capacity deployed by carriers on this trade was 210 000 TEU. Compared to the average weekly capacity in the same period last year, this is the equivalent of adding four 8 750 TEU ships a week.
In contrast, capacity deployed between the Far East and the USWC has fallen by 1.7% in the 12-week period, to an average of 310 000 TEU a week. In other words, there is still 100 000 TEU a week more sailing from the Far East to the USWC than there is to the USEC.
The share of capacity between the two has, however, been adjusted. Last year, in the three months ending 24 July, 66.1% of the capacity from the Far East to the US went to the West Coast. This year that share has fallen to 61.3%.
Looking at volumes shipped in May reveals a similar shift in the share between the two coasts.
The share going to the West Coast has fallen to 59.8%, with the share to the East Coast rising by 4.4 percentage points in May 2022 compared to May 2021.
Volumes from the Far East and the US East Coast are up by 11.9% year to date and were up 7.3% in May 2022 alone compared to the same time last year.
As many of these containers have been moved away from the West Coast to the East Coast, there has been a corresponding drop in volumes imported through the US West Coast from the Far East. These are down 8.0% year to date and were down by 12.8% in May alone compared to May 2021. Total imports from the Far East to North America have risen 0.9% year to date.
The shift in volumes has also led to a change in congestion around the two coasts.
Record high imports to the US East Coast have seen schedule reliability drop to 18.7% in June, indicating that fewer than one in five ships are arriving on time, according to Sea-Intelligence. Those that are arriving late have an average delay of 9 days.
Fewer ships arriving on the West Coast mean that even as onshore disruptions continue to pose huge problems, schedule reliability has in fact improved, reaching 24.8% in June, its highest level in over a year. However, this still means that three out of four ships are arriving late, clocking to an average delay of 9.9 days.
Note:
The 'Weekly Container Rates Update' blog analysis is derived directly from the Xeneta platform, and in some instances, it may diverge from the public rates available on the XSI ®-C (Xeneta Shipping Index by Compass, xsi.xeneta.com. Both indices are based on the same Xeneta data set and data quality procedures; however, they differ in their aggregation methodologies.
Want to learn more?
The container market is no walk in the park. You need to have the latest rate and supply data to be able to plan and execute your freight procurement strategy quickly.
Xeneta's real-time and on-demand data is here to help you answer, "Am I paying the right freight rate to get my cargo where it needs to be?"
Sign up for our weekly 15-minute live group demo below and see Xeneta for yourself.


