Dry container spot rates on major trades are falling globally, including on the westbound transatlantic route. However, reefer spot rates on this trade are on the rise.
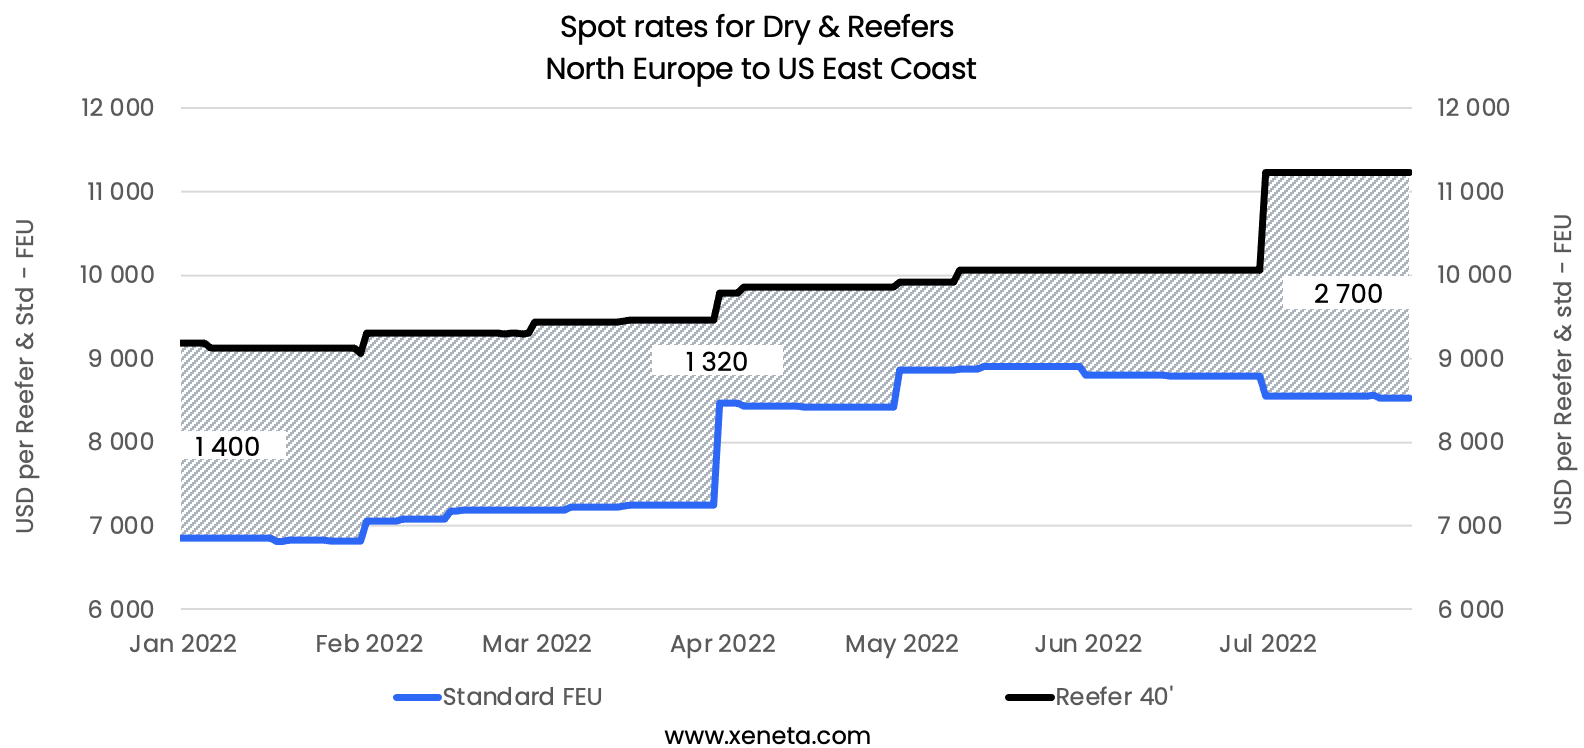
Compared to a month ago, spot rates from North Europe to the US East Coast for 40' reefers were up by USD 1 170 on July 25th, which is 15% higher than at the start of the year.
On July 25th, the average spot rate for reefers was USD 11 230, whereas spot rates for standard FEUs decreased by USD 270 in the same period. Despite the fall in spot rates for standard FEUs, they remain 25% higher than at the start of the year.
Read more below in Xeneta's latest weekly container rate update.
Spot Rates From North Europe to US East Coast
With rates for standard FEUs and 40' reefer containers moving in opposite directions, the spread between the two spot rates for North Europe to US East Coast trade has risen to USD 2 700 on July 25th. This is almost three times higher than the average spread in 2021 and more than the total spot rate for a standard FEU on this trade in July 2019.
A similar increase in spot rates for reefers occurred from the Mediterranean to US East Coast, with rates up USD 1 020 from the end of June.
Compared to a decrease in spot rates for exports of standard FEUs from North Europe, there was a very slight increase in spot rates for these containers out of the Mediterranean. The spot rates for standard FEUs on July 25th, between the Mediterranean and the US East Coast, were USD 9 700, whereas, for 40' reefers, they were at USD 11 860.
On July 25th, shippers could save USD 1 170 on the spot rate for a standard FEU on North Europe to US East coast route compared to the Mediterranean.
However, it would cost USD 630 more for shippers on the spot rate for a 40' reefer container on the Mediterranean to US East coast route when compared to North Europe to US East coast route.
In the first five months of the year, 10.5% of reefer volumes exported from North Europe went to the US East Coast. Reefer volumes on this trade route have grown by 1.8%, whereas total reefer exports from North Europe have dropped by -2.7% YTD.
Note:
The Weekly Container Rates blog analysis is derived directly from the Xeneta platform, and in some instances, it may diverge from the public rates available on the XSI ®-C (Xeneta Shipping Index by Compass, xsi.xeneta.com. Both indices are based on the same Xeneta data set and data quality procedures; however, they differ in their aggregation methodologies.
Want to learn more?
The container market is no walk in the park. You need to have the latest rate and supply data to be able to plan and execute your freight procurement strategy quickly.
Xeneta's real-time and on-demand data is here to help you answer, "Am I paying the right freight rate to get my cargo where it needs to be?"
Sign up for our weekly 15-minute live group demo below and see Xeneta for yourself.


