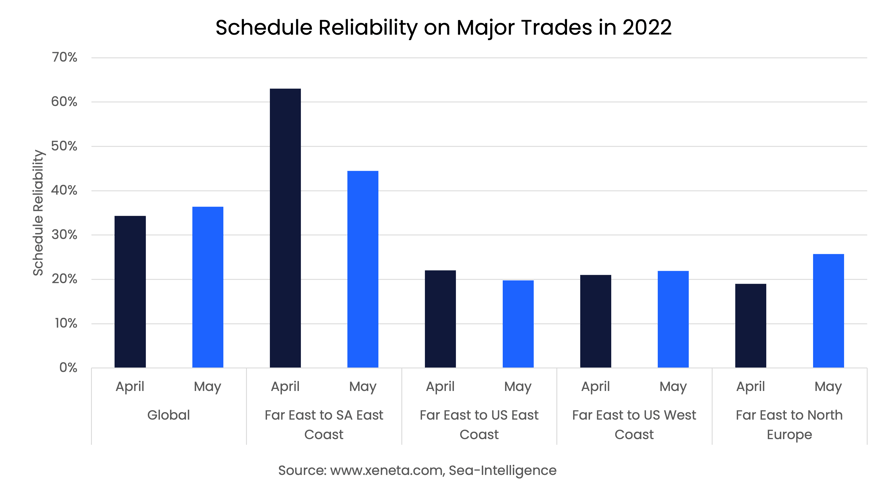
In this week's container rate update, we will focus on schedule reliability improvements. Global schedule reliability went back up to 36% in May after a dip in April. The good news continues with a fall in the average delay in ships arriving late. The average delay has fallen to its lowest level since April last year at 6.1 days. Check out our analysis for some of the major trades below.
The improvement in global schedule reliability and average delays suggest that the amount of capacity tied up due to congestion has fallen to its lowest level since June 2021.
Of the major trades out of the Far East, the South American East Coast had the highest schedule reliability in May, with 45% of ships arriving on time. Despite being the best performing major trade in May, schedule reliability was down between the Far East and the South American East Coast compared to April, where it stood at 63%.
The only other trade out of the Far East to see schedule reliability fall in May compared to April was the Far East to US East Coast. Here only 1 in 5 ships are arriving on time, while the other four in five ships are averaging 8.4 days delay.
US East Coast ports are dealing with record-high volumes as US shippers switch their imports away from the West Coast. The most recent decrease means that for the first time this year, schedule reliability from the Far East to the US East Coast has fallen below that between the Far East and the US West Coast. The US West Coast had schedule reliability of 22% in May, though those ships that were delayed arrived with more delay on the West Coast than those on the East Coast: 10.1 days delay to the former, 1.7 days more than to the latter.
For the Far East - N. Europe, trade schedule reliability rose from April to May, which means that for the first time in over a year, one in four ships arrived on time. Not a particularly impressive milestone, but nonetheless a major improvement for this trade from where it has been, bottoming out at 14% in March.
Note:
The Weekly Container Rates blog analysis is derived directly from the Xeneta platform, and in some instances, it may diverge from the public rates available on the XSI ®-C (Xeneta Shipping Index by Compass, xsi.xeneta.com. Both indices are based on the same Xeneta data set and data quality procedures, however, they differ in their aggregation methodologies.
Want to learn more?
The container market is no walk in the park. You need to have the latest rate and supply data to be able to plan and execute your freight procurement strategy quickly. Xeneta's real-time and on-demand data is here to help you answer, "Am I paying the right freight rate to get my cargo where it needs to be?" Sign up for our weekly 15-minute live group demo below and see Xeneta for yourself.
