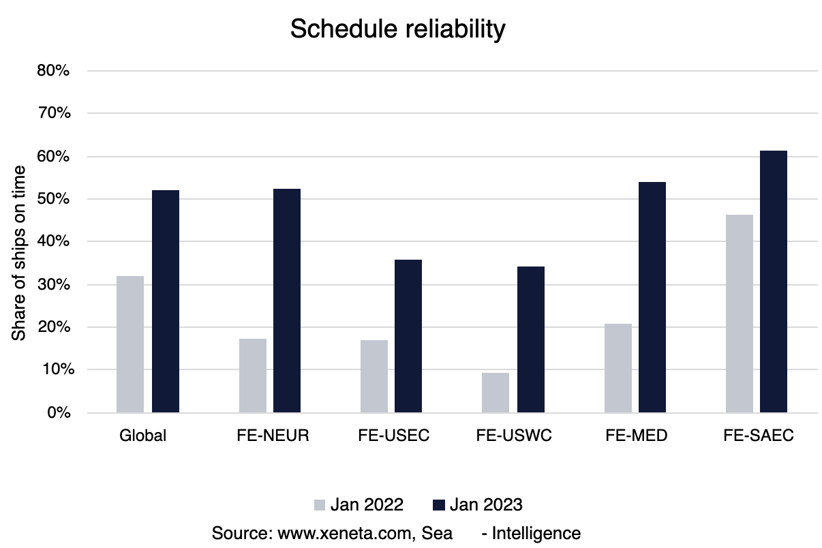
According to the latest data on schedule reliability, one in two ships is still arriving late. In January, 52% of ships arrived on time, which is slightly down from the 56% achieved in late 2022. Also, the average delay for ships arriving late remains stubbornly elevated, which is still above five days.
The current situation is better than a year ago when 79% of ships arrived with an average of 7.9 days delay. But compared to normal market conditions, there is still room for improvement.

In 2019, 78% of ships arrived on time, while the rest had 4.1 days as the average delay time.
Some trades have seen much bigger improvements than the global average, while others are lagging. Of the trades out of the Far East, the biggest improvement in schedule reliability from a year ago is from the Far East to North Europe. This has increased by 35% over the past year but still only stands at 52.1%.
At 68%, MSC has the highest schedule reliability amongst the major carriers. On the other end, Yang Ming and ONE only offer 29% schedule reliability on this trade.
Despite falling volumes and easing congestion into the US, schedule reliability from the Far East into both the US West and East Coasts has yet to show considerable improvement.
From the Far East to the US West Coast, only 1 in 3 ships are arriving on time, dropping by several percentage points from the end of 2022. However, schedule reliability is still up by 25 percentage points from a year ago.
Far East to the US East Coast is only slightly better at 35.7%, up 19.7 percentage points from a year ago. Even the best carriers on this trade only have 4 in 10 ships arriving on time. Wan Hai, the worst carrier on this trade when it comes to schedule reliability, had only 19% of its ships arriving on time in January.
On top of still poor schedule reliability, shippers are dealing with carriers blanking a large number of sailings and services being canceled or changed.
Note:
The 'Weekly Container Rates Update' blog analysis is derived directly from the Xeneta platform. In some instances, it may diverge from the public rates available on the XSI ®-C (Xeneta Shipping Index by Compass, xsi.xeneta.com. Both indices are based on the same Xeneta data set and data quality procedures; however, they differ in their aggregation methodologies.
Want to learn more?
Sign up today for our upcoming monthly State of the Market Webinar to stay on top of the latest market developments and learn how changing market conditions might affect your contract negotiations.
PS: Missed the LIVE session? Sign up to get the full webinar recording.


