As one of the busiest reefer trades, Europe to the Far East, had a quiet year in 2022, considering the number of refrigerated containers moved. Exports from Europe fell across the board in terms of containers moved, but imports to the Far East varied by destination.
In total, the number of reefers fell by 13%, slightly less than 100 000 TEU during Jan-Nov 2022, compared to a year earlier. This is the second year in a row that demand has dropped. After peaking in 2020, volumes fell by 4% in 2021. (Source: CTS)
In essence, all lost volume on this corridor in 2022 involved China – which dropped from a share of 51% of total business on this trade in 2021 down to 41% in 2022. All European origins have witnessed a downward trend throughout the year.

From Europe to China – demand fell by 30% (115k TEU) in 11m-2022 y-o-y. In comparison, demand to North Asia rose by 7.2% and Southeast Asia by 2.6%.
In addition to the easing of the globally strained supply chain, faster repositioning of equipment and weaker demand, the market dynamics were also evident in the rates, especially when the year was ending.
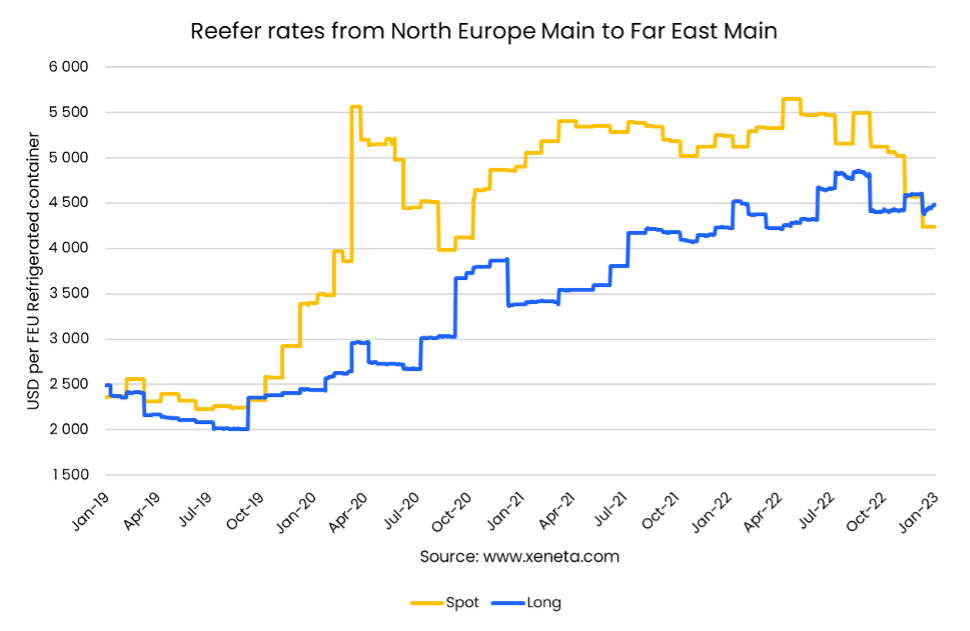
Staying elevated and seemingly not falling as demand declined, spot rates stayed above USD 5 000 per FEU Reefer for almost two years before slipping below in December 2022. The spot rate now sits at USD 4 240 per FEU Reefer by 23 January 2023.
Since hitting a low point in Q3-2019, long-term reefer rates rose from USD 2 000 per FEU reefer to peak at USD 4 850 per reefer in September 2022 before sliding a bit to its current level just below USD 4 500.
Not only did January bring around lower freight rates, it also showed a clear indication of downward pressure for shipping costs.
Spot rates falling below long-term contract rates is a clear sign of very weak market conditions. This phenomenon occurred back in August for dry containers on main trades – and still exists for average rates.
A gap initially opened, where long-term rates were significantly higher than rates offered for spot market cargoes in a fast-falling market. This abnormal condition remains, but the gaps have all crumbled – as the quest for developing the next normal is on for dry as well as for reefers.
Note:
The 'Weekly Container Rates Update' blog analysis is derived directly from the Xeneta platform. In some instances, it may diverge from the public rates available on the XSI ®-C (Xeneta Shipping Index by Compass, xsi.xeneta.com. Both indices are based on the same Xeneta data set and data quality procedures; however, they differ in their aggregation methodologies.
Want to learn more?
Sign up today for our upcoming monthly State of the Market Webinar to stay on top of the latest market developments and learn how changing market conditions might affect your contract negotiations.


