This year promises to herald an ocean freight peak season like no other – namely, one lacking peaks – as demand continues to wane on key global shipping trades.
In a ‘spooked’ economic and geopolitical post-Covid environment, carriers are now busy revising strategies for the traditionally high volume Q3 period. Planned Peak Season Surcharges (PSS) have already been delayed by one month, with growing uncertainty over whether they can be successfully implemented at all.
The Indian Subcontinent to US East Coast corridor - a booming trade lane in 2021 and 2022, with annual volumes of more than 1.1m TEU - provides a telling indication of the current state of play.
Watershed moment
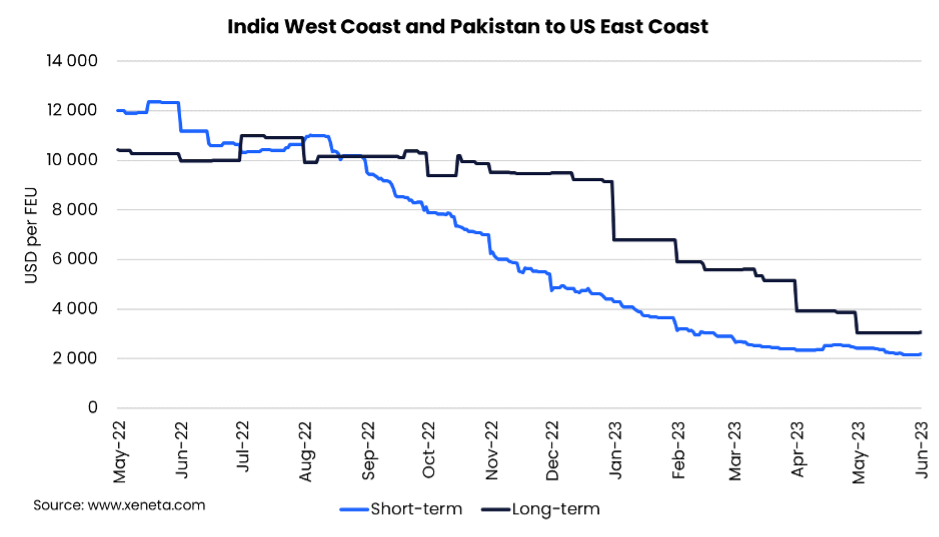
This trade has seen demand drop 25% in the first four months of the year (source: CTS), with obvious impacts upon long- and short-term rates curves that peaked in H1 2022.
Prices on the India West Coast and Pakistan to the US East Coast lanes held steady above USD 10 000 per FEU until September 2022, when demand fell away 18% y-o-y and rates began their downward slide. The second half of 2022 proved to be a watershed moment for shippers, carriers, and freight forwarders, as demand dropped by 16% y-o-y. This provided a stark contrast to the first half of the year, which saw demand leap 17% y-o-y.
That sinking feeling
Spot rates declined steadily, but rapidly, sinking below USD 6 000 in November 2022, below USD 5 000 by early December 2022 and, with the arrival of January 2023, moving into sub-USD 4 000 per FEU territory. By mid-June Xeneta’s data reveals short-term prices of around USD 2 200 – 2 300 per FEU, a level last witnessed before the pandemic, back in December 2019.
For long-term contracts, the first major correction arrived at the start of the year.
In the first three months of 2023, long-term contracted prices dropped 26%, or USD 2 375 per FEU, to USD 6 800 per FEU. This steep decline continued, with long-term rates currently just above USD 3 000 per FEU. As low as this seems, prices can still fall further, with the pre-pandemic benchmark range going down to USD 2 200 per FEU.
Plus one performance?
On 15 June, the tropical cyclone Biparjoy is expected to make landfall in North India, to the west of Mundra, an ominous sign of the turbulent times head. Despite the power of the cyclone, it won’t impact on the fact that Indian west coast ports are full of empties, after a successful repositioning of equipment to ensure containers are in the right place for growing demand. However, that growth is nowhere to be seen, with deflated demand unlikely to fuel a traditional Q3 peak season for embattled carriers.
Nevertheless, in the longer term this trade is very much a ‘one to watch’. With companies keen to establish additional manufacturing bases outside China – the ‘China plus one’ strategy – to secure supply chain resilience, India has strong potential to emerge as ‘the one’.
If you want to learn more check out Xeneta’s special edition of ‘The State of the Ocean Freight Market webinar, here.
Note:
The 'Weekly Container Rates Update' blog analysis is derived directly from the Xeneta platform. In some instances, it may diverge from the public rates available on the XSI ®-C (Xeneta Shipping Index by Compass, xsi.xeneta.com. Both indices are based on the same Xeneta data set and data quality procedures; however, they differ in their aggregation methodologies.
Want to learn more?
Are you looking for visibility into the volatile container shipping market? Find out how simple it is to get the insights and intelligence you need to make sure you, your team and your business quickly adapt to changing market conditions.
Know instantly how your freight rates compare against the market, justify your transportation costs, prepare for your tender period and report on your success with one powerful easy-to-use platform. Get a demo now!


