Audio version:
For some trade corridors, September 2018 has proven to be a month of uncertainty due to tariffs causing slight frenzy from shippers and carriers taking the opportunity to jack up rates. Golden Week is also inching up giving carriers even more open waters to see what they can do before year end. Here is a rundown of the latest September ocean freight rate developments as seen in Xeneta for the trans-Pacific, Asia-Europe, Asia-Australia and Asia – South America corridors.
Far East - US West Coast
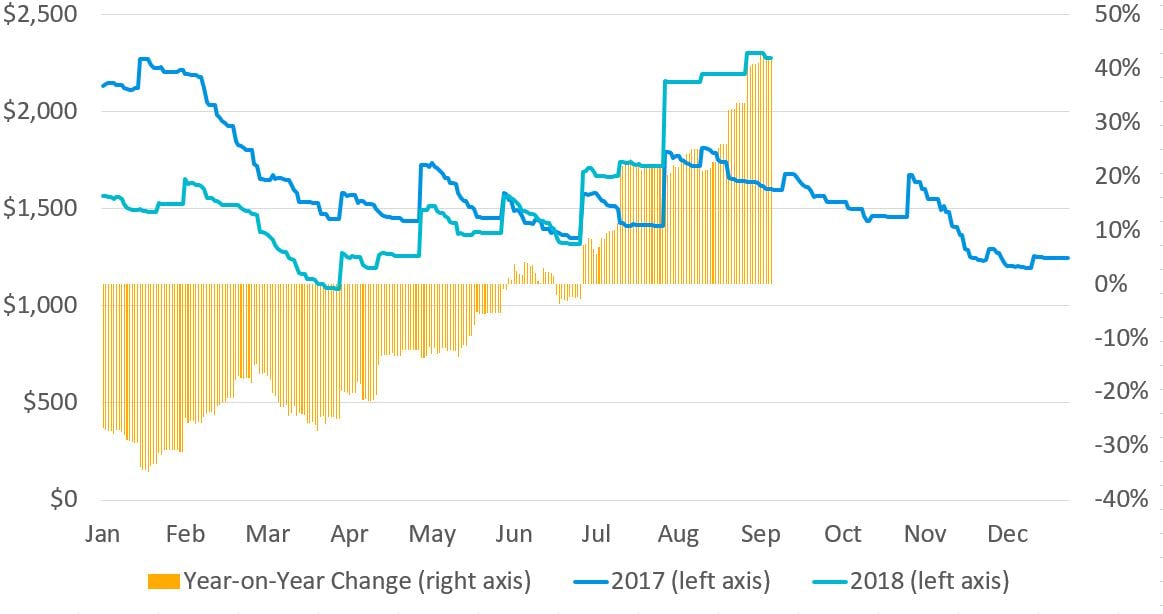
Carriers operating on the US West Coast trade have been the beneficiaries of several rate increases in the past few months and while rates have dropped off slightly over the past week, they have managed to maintain most of the increases.
Over the seven days rates have fallen by just 1.2% to $2,276 FEU, while they’re still 3.7% higher than the end of August.
While some of success carriers have recorded in pushing up rates can be attributed to peak season demand, they have also coincided with the implementation of President Trump’s punitive measures on Chinese imports, which came into force on July 6th.
Reports of a further round of tariffs being applied to an additional $200 billion worth of Chinese goods will have exacerbated peak season demand, with shippers undoubtedly looking to import goods prior to any additional tariffs coming into force.
During this period of uncertainty carriers have seized the chance to lift rates and as shown in Fig 1, have been mostly successful in pushing them up past levels recorded during the same period of 2017. These gains have, therefore, offset some of the year-on-year declines reported during the first six months of the year.
With Golden Week festivities due to start at the beginning of October carriers will be hopeful they can implement at least one more round of increases before the traditional slack season begins. However, longer term questions remain as to how the tariffs may impact consumer demand and current supply chains.
Fig 1: Far East Main to US West Coast ($FEU)
Note: Year-on-year rate increases recorded since July have coincided with President Trump’s import tariffs of 25%.
Far East - North West Europe
Meanwhile, the Far East - North West Europe trade has finally surpassed rates recorded during the same period of 2017. Although rates in February were on par with those recorded at the same time in 2017, it marks the first time this year that rates have meaningfully broken through.
Although rates have climbed by just $66 FEU (3.8%) since the end of August, they are now 4.7% higher than at the equivalent point in 2017, thanks largely to a drop off in rates seen during this time last year.
Fig 2: Far East Main to North West Europe ($FEU)
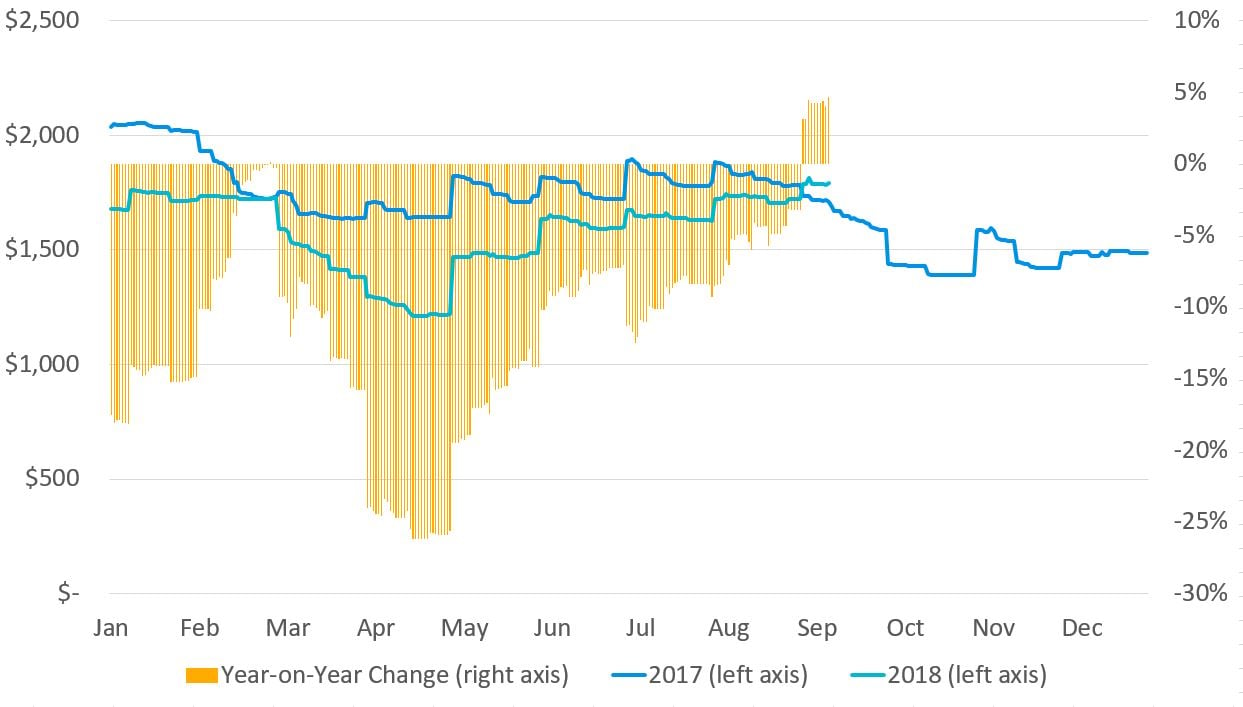
Note: For the first six months of the year, rates on the Far East - North West Europe trade have lagged behind levels recorded during the same period of 2017.
However, with CMA-CGM recently publishing FAK rates of $1,800 FEU effective September 24th, perhaps signaling its intentions to get ahead of rate declines or simply to undercut the market, rates will likely follow last year’s trend. In comparison the French line proposed an FAK rate of $2,000 FEU for the start of September, whilst Hapag-Lloyd is seeking to implement a rate of $2,000 FEU effective September 25th.
The Far East - Australia East Coast
Elsewhere, rate developments on the north south trades have remained mixed.
The Far East - Australia East Coast trade has shown strong year-on-year increases for carriers during the first 8 months of 2018, averaging a premium of 85.2% and have remained relatively stable since April.
However, this could be at risk after it was announced that the port of Melbourne recently received its first 8,000+ TEU vessel. The 8,063 TEU OOCL Seoul is the first of its kind to call at the port, as carriers look to take advantage of increased demand and rates. The question is whether other carriers follow suit and if the introduction of larger vessels will lead to increased rate volatility on the trade.
Rates are already 30.9% lower than the highs of $3,345 FEU reported in Jan-18, so any additional capacity must be carefully managed or carriers risk destabilizing the trade.
Fig 3: Far East Main to Australia East Coast ($FEU)
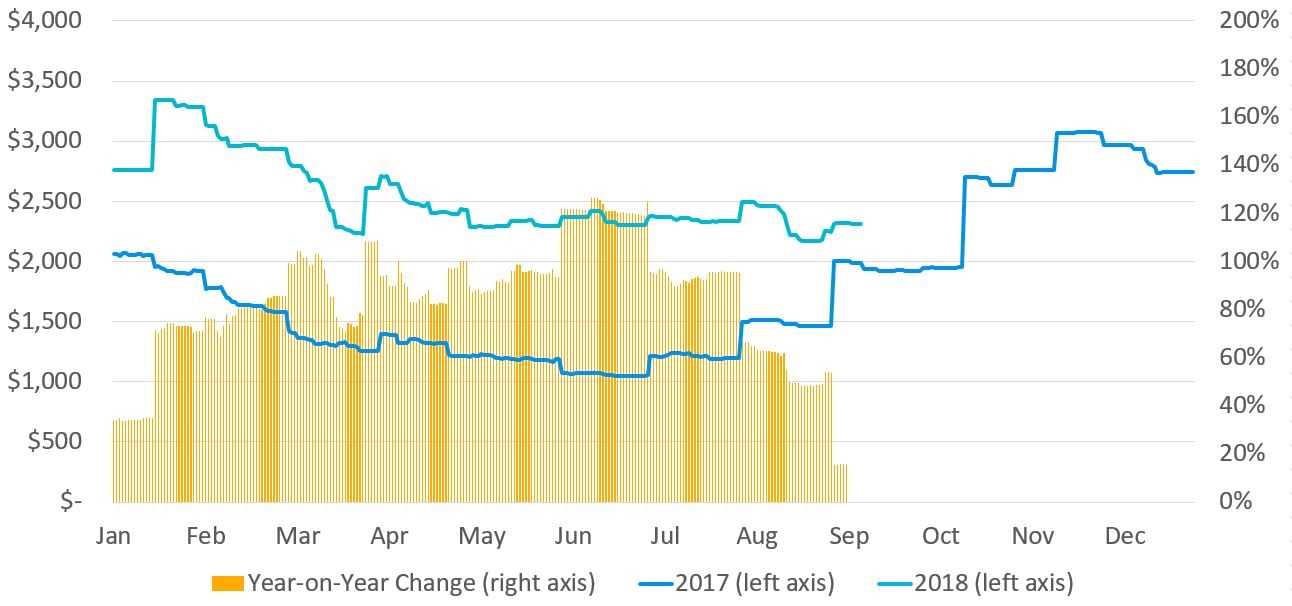 Note: Rates have maintained a healthy premium to levels recorded in 2017, but risk being destabilized with the introduction of larger ships on the trade. The year could, therefore, end in a whimper rather than a bang for an otherwise positive trade lane for carriers.
Far East - East Coast South America
Meanwhile, rate volatility on the Far East - South America East coast trade shows no signs of abating. Although average month-on-month rate volatility year-to-date is 9.2%, compared to 8.6% on the Far East - North West Europe trade, this masks substantial monthly variances. Rate volatility for Sep-18 is currently at 20.2%, similar to the month-on-month change in rates of 20.5% recorded in March.
This volatility can be attributed to carriers use of GRIs. Whilst rates jumped at the start of September due to their latest round of increases, they have now declined by 16.5% to $2,104 FEU and are down 37.7% compared to the high of $3,378 FEU reported in January.
The short-lived nature of these GRIs points to weakness on the trade, but despite their limited success carriers are pushing for yet another round of increases, with Hapag-Lloyd seeking a GRI of $800 per container effective September 25th.
Fig 4: Far East Main to East Coast South America ($FEU)
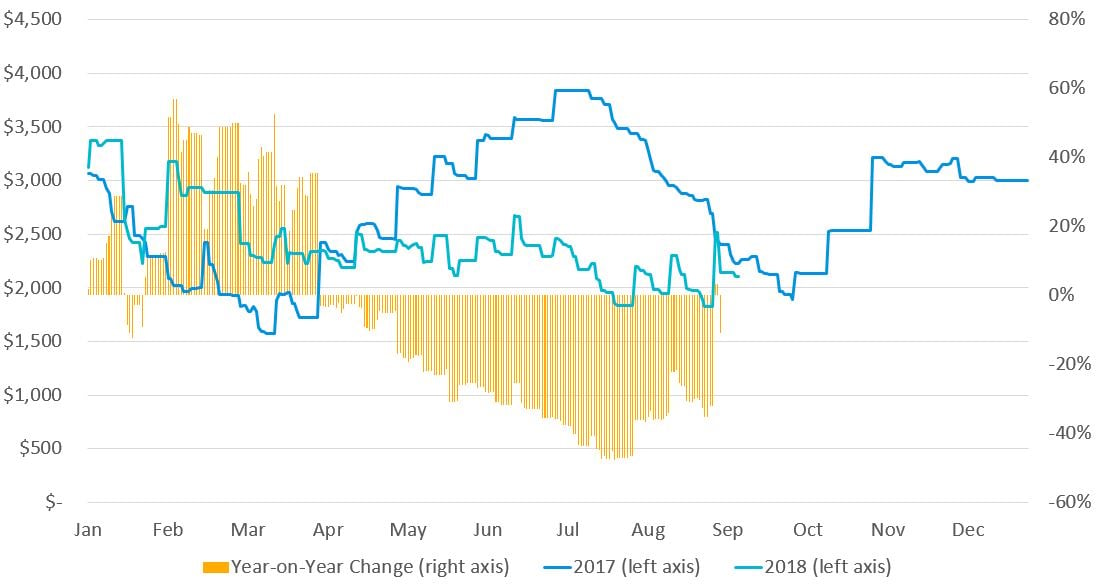 Note: Numerous GRIs have failed to lift rates to the highs reported in 2017 but this hasn’t deterred carriers from trying again.
While the US trades have provided carriers with some positive rate developments in recent months, with the slack season approaching carriers will need to carefully manage capacity to ensure rates don’t follow demand downwards for the remainder of the year.
Stay Updated With the Latest Container Rate Developments
We'll keep our eye out for the latest developments. We'll be reporting the market fluctuations we are seeing in Xeneta on a frequent basis right in our blog. Make sure to stay updated and subscribe to our blog (on the right) to get the latest market information right in your inbox.
